Colorado's 4th congressional district
Colorado's 4th congressional district
Jump to navigation
Jump to search
| Colorado's 4th congressional district | |
|---|---|
 Colorado's 4th congressional district - since January 3, 2013. | |
| U.S. Representative | Ken Buck (R–Greeley) |
| Distribution |
|
| Population (2016) | 795,836[2] |
| Median income | $73,735[3] |
| Ethnicity |
|
| Cook PVI | R+13[4] |
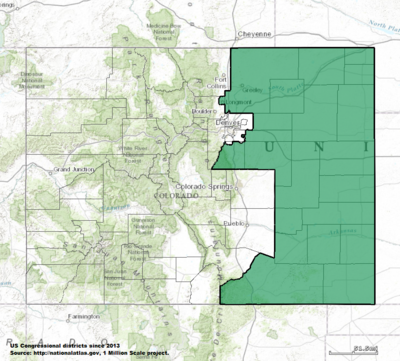
Colorado's 4th congressional district is a congressional district in the U.S. state of Colorado. Located in the eastern part of the state, the district encompasses most of the rural Eastern Plains as well as the larger Colorado Front Range cities of Greeley, Longmont, Castle Rock, and Parker. Interactive map of Colorado's 4th Congressional District.
The district is currently represented by Republican Ken Buck. It is one of the most conservative districts in the Mountain States, especially since the 2010 redistricting removed Fort Collins from the district. No Democrat has seriously contested the district since 2010.
.mw-parser-output .toclimit-2 .toclevel-1 ul,.mw-parser-output .toclimit-3 .toclevel-2 ul,.mw-parser-output .toclimit-4 .toclevel-3 ul,.mw-parser-output .toclimit-5 .toclevel-4 ul,.mw-parser-output .toclimit-6 .toclevel-5 ul,.mw-parser-output .toclimit-7 .toclevel-6 ul{display:none}
Contents
1 History
1.1 1990s
1.2 2000s
1.3 2010s
2 Characteristics
3 Voting
4 List of representatives
5 Election results
5.1 1914
5.2 1916
5.3 1918
5.4 1920
5.5 1922
5.6 1924
5.7 1926
5.8 1928
5.9 1930
5.10 1932
5.11 1934
5.12 1936
5.13 1938
5.14 1940
5.15 1941 (Special)
5.16 1942
5.17 1944
5.18 1946
5.19 1948
5.20 1950
5.21 1952
5.22 1954
5.23 1956
5.24 1958
5.25 1960
5.26 1962
5.27 1964
5.28 1966
5.29 1968
5.30 1970
5.31 1972
5.32 1974
5.33 1976
5.34 1978
5.35 1980
5.36 1982
5.37 1984
5.38 1986
5.39 1988
5.40 1990
5.41 1992
5.42 1994
5.43 1996
5.44 1998
5.45 2000
5.46 2002
5.47 2004
5.48 2006
5.49 2008
5.50 2010
5.51 2012
5.52 2014
5.53 2016
6 Living former Members
7 Historical district boundaries
8 See also
9 References
History[edit]
1990s[edit]
Following the 1990 U.S. Census and associated realignment of Colorado congressional districts, the 4th Congressional district consisted of Baca, Bent, Cheyenne, Crowley, Elbert, Kiowa, Kit Carson, Larimer, Las Animas, Lincoln, Logan, Morgan, Otero, Phillips, Prowers, Sedgwick, Washington, Weld and Yuma counties, as well as portions of Adams, and Arapahoe counties.
2000s[edit]
Following the 2000 U.S. Census and associated realignment of Colorado congressional districts, the 4th Congressional district consisted of Baca, Bent, Cheyenne, Crowley, Kiowa, Kit Carson, Larimer, Lincoln, Logan, Morgan, Phillips, Prowers, Sedgwick, Washington, Weld and Yuma counties, as well as portions of Boulder, and Otero counties.
2010s[edit]
Following the 2010 U.S. Census and associated realignment of Colorado congressional districts, the 4th Congressional district consisted of Baca, Bent, Cheyenne, Crowley, Elbert, Kiowa, Kit Carson, Las Animas, Lincoln, Logan, Morgan, Otero, Phillips, Prowers, Sedgwick, Washington, and Yuma counties. The district also includes portions of Adams, Arapahoe, Boulder, Douglas, and Weld counties.
Characteristics[edit]
This district consists mainly of the area of Colorado that is part of the Great Plains region of the United States. It is largely rural. The only large cities in the district are Greeley, Longmont, Castle Rock, and Parker. Until the 2010s redistricting, Fort Collins was the largest city in the district.
Historically, the district has been friendly territory for congressional Republicans, though Marilyn Musgrave only narrowly won in 2004 and 2006 due to her Democratic opponents' strength in Fort Collins. Musgrave had to rely on strong performances in more conservative Greeley to hold onto her seat. In 2008, Musgrave lost reelection to Betsy Markey, the first Democrat to be elected by the 4th District since the early 1970s.
George W. Bush received 58% of the vote in this district in 2004. John McCain narrowly carried the district in 2008 with 50% of the vote.
Voting[edit]
Election results from presidential races[5]
| Election results from presidential races | ||
|---|---|---|
| Year | Office | Results |
| 2000 | President | Bush 57 - 37% |
| 2004 | President | Bush 58 - 41% |
| 2008 | President | McCain 50 - 49% |
| 2012 | President | Romney 59 - 40% |
| 2016 | President | Trump 57 – 34% |
List of representatives[edit]
| Representative | Party | Term Duration | Congress | District Home | Electoral history |
|---|---|---|---|---|---|
| District created March 4, 1915 | Districts 3 and 4 were created from the former at-large district | ||||
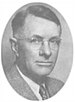
 Edward T. Taylor Edward T. Taylor | Democratic | March 4, 1915 – September 3, 1941 | 64th | Glenwood Springs | First elected in 1908 (At-large district) Died |
65th | |||||
66th | |||||
67th | |||||
68th | |||||
69th | |||||
70th | |||||
71st | |||||
72nd | |||||
73rd | |||||
74th | |||||
75th | |||||
76th | |||||
77th | |||||
Vacant | September 3, 1941 – December 9, 1941 | 77th | |||
 Robert F. Rockwell Robert F. Rockwell | Republican | December 9, 1941 – January 3, 1949 | 77th | Paonia | Won special election to finish remaining term Won in the 1942 general election Lost re-election |
78th | |||||
79th | |||||
80th | |||||
 Wayne Aspinall Wayne Aspinall | Democratic | January 3, 1949 – January 3, 1973 | 81st | Palisade | First elected in 1948 Lost party re-nomination |
82nd | |||||
83rd | |||||
84th | |||||
85th | |||||
86th | |||||
87th | |||||
88th | |||||
89th | |||||
90th | |||||
91st | |||||
92nd | |||||
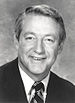
 Jim Johnson Jim Johnson | Republican | January 3, 1973 – January 3, 1981 | 93rd | Fort Collins | First elected in 1972 Retired |
94th | |||||
95th | |||||
96th | |||||
 Hank Brown Hank Brown | Republican | January 3, 1981 – January 3, 1991 | 97th | Greeley | First elected in 1980 Retired to run for U.S. Senate |
98th | |||||
99th | |||||
100th | |||||
101st | |||||
 Wayne Allard Wayne Allard | Republican | January 3, 1991 – January 3, 1997 | 102nd | Loveland | First elected in 1990 Retired to run for U.S. Senate |
103rd | |||||
104th | |||||
 Bob Schaffer Bob Schaffer | Republican | January 3, 1997 – January 3, 2003 | 105th | Fort Collins | First elected in 1996 Retired |
106th | |||||
107th | |||||
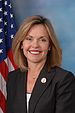
 Marilyn Musgrave Marilyn Musgrave | Republican | January 3, 2003 – January 3, 2009 | 108th | Fort Morgan | First elected in 2002 Lost re-election |
109th | |||||
110th | |||||
 Betsy Markey Betsy Markey | Democratic | January 3, 2009 – January 3, 2011 | 111th | Fort Collins | Elected in 2008 Lost re-election |
 Cory Gardner Cory Gardner | Republican | January 3, 2011 – January 3, 2015 | 112th | Yuma | First elected in 2010 elected to the US Senate in 2014 |
113th | |||||
 Ken Buck Ken Buck | Republican | January 3, 2015 – | 114th | Greeley | First elected in 2014 |
Election results[edit]
1914 • 1916 • 1918 • 1920 • 1922 • 1924 • 1926 • 1928 • 1930 • 1932 • 1934 • 1936 • 1938 • |
1914[edit]
| Party | Candidate | Votes | % | ||
|---|---|---|---|---|---|
Democratic | Edward T. Taylor (incumbent) | 26,562 | 57.83 | ||
Republican | H.J. Baird | 15,015 | 32.69 | ||
Socialist | George Kunkle | 4,353 | 9.48 | ||
| Total votes | 45,930 | 100.0 | |||
Democratic win (new seat) | |||||
1916[edit]
| Party | Candidate | Votes | % | |
|---|---|---|---|---|
Democratic | Edward T. Taylor (incumbent) | 30,926 | 65.78 | |
Republican | H.J. Baird | 13,397 | 28.49 | |
Socialist | Emery D. Cox | 2,695 | 5.73 | |
| Total votes | 47,018 | 100.0 | ||
Democratic hold | ||||
1918[edit]
| Party | Candidate | Votes | % | |
|---|---|---|---|---|
Democratic | Edward T. Taylor (incumbent) | 22,423 | 65.72 | |
Republican | Straud M. Logan | 11,695 | 34.28 | |
| Total votes | 34,118 | 100.0 | ||
Democratic hold | ||||
1920[edit]
| Party | Candidate | Votes | % | |
|---|---|---|---|---|
Democratic | Edward T. Taylor (incumbent) | 25,994 | 55.32 | |
Republican | Merle D. Vincent | 20,991 | 44.68 | |
| Total votes | 46,985 | 100.0 | ||
Democratic hold | ||||
1922[edit]
| Party | Candidate | Votes | % | |
|---|---|---|---|---|
Democratic | Edward T. Taylor (incumbent) | 30,331 | 64.26 | |
Republican | Merle D. Vincent | 16,870 | 35.74 | |
| Total votes | 47,201 | 100.0 | ||
Democratic hold | ||||
1924[edit]
| Party | Candidate | Votes | % | |
|---|---|---|---|---|
Democratic | Edward T. Taylor (incumbent) | 33,262 | 65.54 | |
Republican | Webster S. Whinnery | 17,486 | 34.46 | |
| Total votes | 50,748 | 100.0 | ||
Democratic hold | ||||
1926[edit]
| Party | Candidate | Votes | % | |
|---|---|---|---|---|
Democratic | Edward T. Taylor (incumbent) | 32,093 | 66.75 | |
Republican | Webster S. Whinnery | 15,990 | 33.25 | |
| Total votes | 48,083 | 100.0 | ||
Democratic hold | ||||
1928[edit]
| Party | Candidate | Votes | % | |
|---|---|---|---|---|
Democratic | Edward T. Taylor (incumbent) | 30,142 | 58.84 | |
Republican | William P. Dale | 21,089 | 41.16 | |
| Total votes | 51,231 | 100.0 | ||
Democratic hold | ||||
1930[edit]
| Party | Candidate | Votes | % | |
|---|---|---|---|---|
Democratic | Edward T. Taylor (incumbent) | 34,536 | 66.95 | |
Republican | Webster S. Whinnery | 17,051 | 33.05 | |
| Total votes | 51,587 | 100.0 | ||
Democratic hold | ||||
1932[edit]
| Party | Candidate | Votes | % | |
|---|---|---|---|---|
Democratic | Edward T. Taylor (incumbent) | 40,736 | 65.99 | |
Republican | Richard C. Callen | 20,993 | 34.01 | |
| Total votes | 61,729 | 100.0 | ||
Democratic hold | ||||
1934[edit]
| Party | Candidate | Votes | % | |
|---|---|---|---|---|
Democratic | Edward T. Taylor (incumbent) | 39,747 | 67.30 | |
Republican | Harry McDevitt | 17,234 | 29.18 | |
| Veterans' Party | Gustavis A. Billstrom | 1,625 | 2.75 | |
Independent | O.W. Daggett | 457 | 0.77 | |
| Total votes | 59,063 | 100.0 | ||
Democratic hold | ||||
1936[edit]
| Party | Candidate | Votes | % | |
|---|---|---|---|---|
Democratic | Edward T. Taylor (incumbent) | 42,010 | 65.45 | |
Republican | John S. Woody | 22,175 | 34.55 | |
| Total votes | 64,185 | 100.0 | ||
Democratic hold | ||||
1938[edit]
| Party | Candidate | Votes | % | |
|---|---|---|---|---|
Democratic | Edward T. Taylor (incumbent) | 43,596 | 63.74 | |
Republican | John S. Woody | 24,805 | 36.26 | |
| Total votes | 68,401 | 100.0 | ||
Democratic hold | ||||
1940[edit]
| Party | Candidate | Votes | % | |
|---|---|---|---|---|
Democratic | Edward T. Taylor (incumbent) | 44,095 | 59.41 | |
Republican | Paul W. Crawford | 30,126 | 40.59 | |
| Total votes | 74,221 | 100.0 | ||
Democratic hold | ||||
1941 (Special)[edit]
| Party | Candidate | Votes | % | |||
|---|---|---|---|---|---|---|
Republican | Robert F. Rockwell | 19,918 | 54.04 | |||
Democratic | Frank Delaney | 16,941 | 45.96 | |||
| Total votes | 36,859 | 100.0 | ||||
Republican gain from Democratic | ||||||
1942[edit]
| Party | Candidate | Votes | % | |
|---|---|---|---|---|
Republican | Robert F. Rockwell (incumbent) | 28,460 | 58.75 | |
Democratic | Elizabeth E. Pellet | 19,979 | 41.25 | |
| Total votes | 48,439 | 100.0 | ||
Republican hold | ||||
1944[edit]
| Party | Candidate | Votes | % | |
|---|---|---|---|---|
Republican | Robert F. Rockwell (incumbent) | 38,671 | 61.67 | |
Democratic | John L. Heuschkel | 24,039 | 38.33 | |
| Total votes | 62,710 | 100.0 | ||
Republican hold | ||||
1946[edit]
| Party | Candidate | Votes | % | |
|---|---|---|---|---|
Republican | Robert F. Rockwell (incumbent) | 28,894 | 58.75 | |
Democratic | Thomas Matthews | 20,290 | 41.25 | |
| Total votes | 49,184 | 100.0 | ||
Republican hold | ||||
1948[edit]
| Party | Candidate | Votes | % | |||
|---|---|---|---|---|---|---|
Democratic | Wayne Aspinall | 34,695 | 51.86 | |||
Republican | Robert F. Rockwell (incumbent) | 32,206 | 48.14 | |||
| Total votes | 66,901 | 100.0 | ||||
Democratic gain from Republican | ||||||
1950[edit]
| Party | Candidate | Votes | % | |
|---|---|---|---|---|
Democratic | Wayne Aspinall (incumbent) | 35,797 | 57.30 | |
Republican | Jack Evans | 26,674 | 42.70 | |
| Total votes | 62,471 | 100.0 | ||
Democratic hold | ||||
1952[edit]
| Party | Candidate | Votes | % | |
|---|---|---|---|---|
Democratic | Wayne Aspinall (incumbent) | 39,676 | 50.02 | |
Republican | Howard M. Shults | 39,647 | 49.98 | |
| Total votes | 79,323 | 100.0 | ||
Democratic hold | ||||
1954[edit]
| Party | Candidate | Votes | % | |
|---|---|---|---|---|
Democratic | Wayne Aspinall (incumbent) | 34,294 | 53.49 | |
Republican | Charles E. Wilson | 29,818 | 46.51 | |
| Total votes | 64,112 | 100.0 | ||
Democratic hold | ||||
1956[edit]
| Party | Candidate | Votes | % | |
|---|---|---|---|---|
Democratic | Wayne Aspinall (incumbent) | 48,489 | 61.76 | |
Republican | Hugh Caldwell | 30,026 | 38.24 | |
| Total votes | 78,515 | 100.0 | ||
Democratic hold | ||||
1958[edit]
| Party | Candidate | Votes | % | |
|---|---|---|---|---|
Democratic | Wayne Aspinall (incumbent) | 43,785 | 63.61 | |
Republican | J.R. "Dick" Wells | 25,048 | 36.39 | |
| Total votes | 68,833 | 100.0 | ||
Democratic hold | ||||
1960[edit]
| Party | Candidate | Votes | % | |
|---|---|---|---|---|
Democratic | Wayne Aspinall (incumbent) | 58,731 | 68.54 | |
Republican | Charles P. Casteel | 26,960 | 31.46 | |
| Total votes | 85,691 | 100.0 | ||
Democratic hold | ||||
1962[edit]
| Party | Candidate | Votes | % | |
|---|---|---|---|---|
Democratic | Wayne Aspinall (incumbent) | 42,462 | 58.65 | |
Republican | Leo L. Sommerville | 29,943 | 41.36 | |
| Total votes | 72,405 | 100.0 | ||
Democratic hold | ||||
1964[edit]
| Party | Candidate | Votes | % | |
|---|---|---|---|---|
Democratic | Wayne Aspinall (incumbent) | 106,685 | 63.02 | |
Republican | Edwin S. Lamm | 62,617 | 36.98 | |
| Total votes | 169,302 | 100.0 | ||
Democratic hold | ||||
1966[edit]
| Party | Candidate | Votes | % | |
|---|---|---|---|---|
Democratic | Wayne Aspinall (incumbent) | 84,107 | 58.61 | |
Republican | James Paul Johnson | 59,404 | 41.39 | |
| Total votes | 143,511 | 100.0 | ||
Democratic hold | ||||
1968[edit]
| Party | Candidate | Votes | % | |
|---|---|---|---|---|
Democratic | Wayne Aspinall (incumbent) | 92,680 | 54.69 | |
Republican | Fred E. Anderson | 76,776 | 45.31 | |
| Total votes | 169,456 | 100.0 | ||
Democratic hold | ||||
1970[edit]
| Party | Candidate | Votes | % | |
|---|---|---|---|---|
Democratic | Wayne Aspinall (incumbent) | 76,244 | 55.08 | |
Republican | Bill Gossard | 62,169 | 44.92 | |
| Total votes | 138,413 | 100.0 | ||
Democratic hold | ||||
1972[edit]
| Party | Candidate | Votes | % | |||
|---|---|---|---|---|---|---|
Republican | James Paul Johnson | 94,994 | 51.03 | |||
Democratic | Alan Merson | 91,151 | 48.97 | |||
| Total votes | 186,145 | 100.0 | ||||
Republican gain from Democratic | ||||||
1974[edit]
| Party | Candidate | Votes | % | |
|---|---|---|---|---|
Republican | James Paul Johnson (incumbent) | 82,982 | 52.05 | |
Democratic | John Carroll | 76,452 | 47.95 | |
| Total votes | 159,434 | 100.0 | ||
Republican hold | ||||
1976[edit]
| Party | Candidate | Votes | % | |
|---|---|---|---|---|
Republican | James Paul Johnson (incumbent) | 119,458 | 54.05 | |
Democratic | Daniel Ogden | 76,995 | 34.84 | |
Independent | Dick Davis | 20,398 | 9.23 | |
Independent | Henry Thiel | 4,167 | 1.89 | |
| Total votes | 221,018 | 100.0 | ||
Republican hold | ||||
1978[edit]
| Party | Candidate | Votes | % | |
|---|---|---|---|---|
Republican | James Paul Johnson (incumbent) | 103,121 | 61.18 | |
Democratic | Morgan Smith | 65,421 | 38.82 | |
| Total votes | 168,542 | 100.0 | ||
Republican hold | ||||
1980[edit]
| Party | Candidate | Votes | % | |
|---|---|---|---|---|
Republican | Hank Brown | 178,221 | 68.42 | |
Democratic | Polly Baca | 76,849 | 29.50 | |
Libertarian | Cynthia Molson-Smith | 5,421 | 2.08 | |
| Total votes | 260,491 | 100.0 | ||
Republican hold | ||||
1982[edit]
| Party | Candidate | Votes | % | |
|---|---|---|---|---|
Republican | Hank Brown (incumbent) | 105,550 | 69.76 | |
Democratic | Charles "Bud" Bishopp | 45,750 | 30.24 | |
| Total votes | 151,300 | 100.0 | ||
Republican hold | ||||
1984[edit]
| Party | Candidate | Votes | % | |
|---|---|---|---|---|
Republican | Hank Brown (incumbent) | 146,469 | 71.13 | |
Democratic | Mary Fagan Bates | 56,462 | 27.42 | |
Libertarian | Randy Fitzgerald | 2,999 | 1.45 | |
| Total votes | 205,930 | 100.0 | ||
Republican hold | ||||
1986[edit]
| Party | Candidate | Votes | % | |
|---|---|---|---|---|
Republican | Hank Brown (incumbent) | 117,089 | 69.80 | |
Democratic | David Sprague | 50,672 | 30.20 | |
| Total votes | 167,761 | 100.0 | ||
Republican hold | ||||
1988[edit]
| Party | Candidate | Votes | % | |
|---|---|---|---|---|
Republican | Hank Brown (incumbent) | 156,202 | 73.08 | |
Democratic | Charles S. Vigil | 57,552 | 26.92 | |
| Total votes | 213,754 | 100.0 | ||
Republican hold | ||||
1990[edit]
| Party | Candidate | Votes | % | |
|---|---|---|---|---|
Republican | Wayne Allard | 89,285 | 54.05 | |
Democratic | Richard R. "Dick" Bond | 75,901 | 45.95 | |
| Total votes | 165,186 | 100.0 | ||
Republican hold | ||||
1992[edit]
| Party | Candidate | Votes | % | |
|---|---|---|---|---|
Republican | Wayne Allard (incumbent) | 139,884 | 57.84 | |
Democratic | Tom Redder | 101,957 | 42.16 | |
| Total votes | 241,841 | 100.0 | ||
Republican hold | ||||
1994[edit]
| Party | Candidate | Votes | % | |
|---|---|---|---|---|
Republican | Wayne Allard (incumbent) | 136,251 | 72.30 | |
Democratic | Cathy Kipp | 52,202 | 27.70 | |
| Total votes | 188,453 | 100.0 | ||
Republican hold | ||||
1996[edit]
| Party | Candidate | Votes | % | |
|---|---|---|---|---|
Republican | Bob Schaffer | 137,012 | 56.14 | |
Democratic | Guy Kelley | 92,837 | 38.04 | |
American | Wesley Paul "Wes" McKinley | 7,428 | 3.04 | |
Natural Law | Cynthia Parker | 6,790 | 2.78 | |
| Total votes | 244,067 | 100.0 | ||
Republican hold | ||||
1998[edit]
| Party | Candidate | Votes | % | |
|---|---|---|---|---|
Republican | Bob Schaffer (incumbent) | 131,318 | 59.34 | |
Democratic | Susan Kirkpatrick | 89,973 | 40.66 | |
| Total votes | 221,291 | 100.0 | ||
Republican hold | ||||
2000[edit]
| Party | Candidate | Votes | % | |
|---|---|---|---|---|
Republican | Bob Schaffer (incumbent) | 209,078 | 79.50 | |
Natural Law | Dan Sewell Ward | 19,721 | 7.50 | |
Libertarian | Kordon L. Baker | 19,713 | 7.50 | |
Constitution | Leslie J. Hanks | 9,955 | 3.77 | |
| Write-in | 4,539 | 1.73 | ||
| Total votes | 263,006 | 100.0 | ||
Republican hold | ||||
2002[edit]
| Party | Candidate | Votes | % | |
|---|---|---|---|---|
Republican | Marilyn Musgrave | 115,359 | 54.95 | |
Democratic | Stan Matsunaka | 87,499 | 41.68 | |
Libertarian | John Volz | 7,097 | 3.37 | |
| Total votes | 209,955 | 100.0 | ||
Republican hold | ||||
2004[edit]
| Party | Candidate | Votes | % | |
|---|---|---|---|---|
Republican | Marilyn Musgrave (incumbent) | 155,958 | 51.05 | |
Democratic | Stan Matsunaka | 136,812 | 44.78 | |
Green | Bob Kinsey | 12,739 | 4.17 | |
| Total votes | 305,509 | 100.0 | ||
Republican hold | ||||
2006[edit]
| Party | Candidate | Votes | % | |
|---|---|---|---|---|
Republican | Marilyn Musgrave (incumbent) | 109,732 | 45.61 | |
Democratic | Angie Paccione | 103,748 | 43.11 | |
Reform | Eric Eidsness | 27,133 | 11.28 | |
| Total votes | 240,613 | 100.0 | ||
Republican hold | ||||
2008[edit]
| Party | Candidate | Votes | % | |||
|---|---|---|---|---|---|---|
Democratic | Betsy Markey | 187,348 | 56% | |||
Republican | Marilyn Musgrave (incumbent) | 146,030 | 44% | |||
| Total votes | 333,378 | 100% | ||||
Democratic gain from Republican | ||||||
2010[edit]
| Party | Candidate | Votes | % | |||
|---|---|---|---|---|---|---|
Republican | Cory Gardner | 138,634 | 52% | |||
Democratic | Betsy Markey (incumbent) | 109,249 | 41% | |||
Constitution | Doug Aden | 12,312 | 5% | |||
No party | Ken "Wasko" Waszkiewicz | 3,986 | 2% | |||
| Total votes | 264,181 | 100% | ||||
Republican gain from Democratic | ||||||
2012[edit]
| Party | Candidate | Votes | % | |
|---|---|---|---|---|
Republican | Cory Gardner (incumbent) | 200,006 | 59% | |
Democratic | Brandon Shaffer | 128,800 | 37% | |
Libertarian | Josh Gilliland | 10,682 | 3% | |
Constitution | Doug Aden | 5,848 | 1% | |
| Total votes | 342,336 | 100% | ||
Republican hold | ||||
2014[edit]
| Party | Candidate | Votes | % | |
|---|---|---|---|---|
Republican | Ken Buck | 185,292 | 65% | |
Democratic | Vic Meyers | 83,727 | 29% | |
Libertarian | Jess Loban | 9,472 | 3% | |
Independent | Grant Doherty | 8,016 | 3% | |
| Total votes | 286,507 | 100% | ||
Republican hold | ||||
2016[edit]
| Party | Candidate | Votes | % | |
|---|---|---|---|---|
Republican | Ken Buck | 248,230 | 63.5% | |
Democratic | Bob Seay | 123,642 | 31.7% | |
Libertarian | Bruce Griffith | 18,761 | 4.8% | |
| Total votes | 390,633 | 100% | ||
Republican hold | ||||
Living former Members[edit]
As of May 2015[update], there are seven former members of the U.S. House of Representatives from Colorado's 4th congressional district who are currently living at this time.
| Representative | Term in office | Date of birth (and age) |
|---|---|---|
James Paul Johnson | 1973–1981 | (1930-06-02) June 2, 1930 |
Hank Brown | 1981–1991 | (1940-02-12) February 12, 1940 |
Wayne Allard | 1991–1997 | (1943-12-02) December 2, 1943 |
Bob Schaffer | 1997–2003 | (1962-07-24) July 24, 1962 |
Marilyn Musgrave | 2003–2009 | (1949-01-27) January 27, 1949 |
Betsy Markey | 2009–2011 | (1956-04-27) April 27, 1956 |
Cory Gardner | 2011–2015 | (1974-08-22) August 22, 1974 |
Historical district boundaries[edit]

2003 - 2013
See also[edit]
- Colorado's congressional districts
- List of United States congressional districts
References[edit]
Martis, Kenneth C. (1989). The Historical Atlas of Political Parties in the United States Congress. New York: Macmillan Publishing Company..mw-parser-output cite.citation{font-style:inherit}.mw-parser-output q{quotes:"""""""'""'"}.mw-parser-output code.cs1-code{color:inherit;background:inherit;border:inherit;padding:inherit}.mw-parser-output .cs1-lock-free a{background:url("//upload.wikimedia.org/wikipedia/commons/thumb/6/65/Lock-green.svg/9px-Lock-green.svg.png")no-repeat;background-position:right .1em center}.mw-parser-output .cs1-lock-limited a,.mw-parser-output .cs1-lock-registration a{background:url("//upload.wikimedia.org/wikipedia/commons/thumb/d/d6/Lock-gray-alt-2.svg/9px-Lock-gray-alt-2.svg.png")no-repeat;background-position:right .1em center}.mw-parser-output .cs1-lock-subscription a{background:url("//upload.wikimedia.org/wikipedia/commons/thumb/a/aa/Lock-red-alt-2.svg/9px-Lock-red-alt-2.svg.png")no-repeat;background-position:right .1em center}.mw-parser-output .cs1-subscription,.mw-parser-output .cs1-registration{color:#555}.mw-parser-output .cs1-subscription span,.mw-parser-output .cs1-registration span{border-bottom:1px dotted;cursor:help}.mw-parser-output .cs1-hidden-error{display:none;font-size:100%}.mw-parser-output .cs1-visible-error{font-size:100%}.mw-parser-output .cs1-subscription,.mw-parser-output .cs1-registration,.mw-parser-output .cs1-format{font-size:95%}.mw-parser-output .cs1-kern-left,.mw-parser-output .cs1-kern-wl-left{padding-left:0.2em}.mw-parser-output .cs1-kern-right,.mw-parser-output .cs1-kern-wl-right{padding-right:0.2em}
Martis, Kenneth C. (1982). The Historical Atlas of United States Congressional Districts. New York: Macmillan Publishing Company.
- Congressional Biographical Directory of the United States 1774–present
^ Geography, US Census Bureau. "Congressional Districts Relationship Files (state-based)". www.census.gov.
^ Bureau, Center for New Media & Promotion (CNMP), US Census. "My Congressional District". www.census.gov.
^ https://www.census.gov/mycd/?st=08&cd=04
^ "Partisan Voting Index – Districts of the 115th Congress" (PDF). The Cook Political Report. April 7, 2017. Retrieved April 7, 2017.
^ Presidential Election Results, by district, swingstateproject.com
^ "Our Campaigns - CO District 4 Race - Nov 03, 1914". www.ourcampaigns.com.
^ "Our Campaigns - CO District 4 Race - Nov 07, 1916". www.ourcampaigns.com.
^ "Our Campaigns - CO District 4 Race - Nov 05, 1918". www.ourcampaigns.com.
^ "1920 Election Results" (PDF). house.gov.
^ "1922 Election Results" (PDF). house.gov.
^ "1924 Election Results" (PDF). house.gov.
^ "1926 Election Results" (PDF). house.gov.
^ "1928 Election Results" (PDF). house.gov.
^ "1930 Election Results" (PDF). house.gov.
^ "1932 Election Results" (PDF). house.gov.
^ "1934 Election Results" (PDF). house.gov.
^ "1936 Election Results" (PDF). house.gov.
^ "1938 Election Results" (PDF). house.gov.
^ "1940 Election Results" (PDF). house.gov.
^ "Our Campaigns - CO District 4 - Special Election Race - Dec 09, 1941". www.ourcampaigns.com.
^ "1942 Election Results" (PDF). house.gov.
^ "1944 Election Results" (PDF). house.gov.
^ "1946 Election Results" (PDF). house.gov.
^ "1948 Election Results" (PDF). house.gov.
^ "1950 Election Results" (PDF). house.gov.
^ "1952 Election Results" (PDF). house.gov.
^ "1954 Election Results" (PDF). house.gov.
^ "1956 Election Results" (PDF). house.gov.
^ "1958 Election Results" (PDF). house.gov.
^ "1960 Election Results" (PDF). house.gov.
^ "1962 Election Results" (PDF). house.gov.
^ "1964 Election Results" (PDF). house.gov.
^ "1966 Election Results" (PDF). house.gov.
^ "1968 Election Results" (PDF). house.gov.
^ "1970 Election Results" (PDF). house.gov.
^ "1972 Election Results" (PDF). house.gov.
^ "1974 Election Results" (PDF). house.gov.
^ "1976 Election Results" (PDF). house.gov.
^ "1978 Election Results" (PDF). house.gov.
^ "1980 Election Results" (PDF). house.gov.
^ "1982 Election Results" (PDF). house.gov.
^ "1984 Election Results" (PDF). house.gov.
^ "1986 Election Results" (PDF). house.gov.
^ "1988 Election Results" (PDF). house.gov.
^ "1990 Election Results" (PDF). house.gov.
^ "1992 Election Results" (PDF). house.gov.
^ "1994 Election Results" (PDF). house.gov.
^ "1996 Election Results" (PDF). house.gov.
^ "1998 Election Results" (PDF). house.gov.
^ "2000 Election Results" (PDF). house.gov.
^ "2002 Election Results" (PDF). house.gov.
^ "2004 Election Results" (PDF). house.gov.
^ "2006 Election Results" (PDF). house.gov.
^ "2008 Election Results" (PDF). house.gov.
^ abcd "2010 Election Results". state.co.us.
Coordinates: 39°04′15″N 103°24′50″W / 39.07083°N 103.41389°W / 39.07083; -103.41389
Categories:
- Congressional districts of Colorado
- Eastern Plains
- 1915 establishments in Colorado
(window.RLQ=window.RLQ||).push(function(){mw.config.set({"wgPageParseReport":{"limitreport":{"cputime":"1.164","walltime":"1.339","ppvisitednodes":{"value":28384,"limit":1000000},"ppgeneratednodes":{"value":0,"limit":1500000},"postexpandincludesize":{"value":207380,"limit":2097152},"templateargumentsize":{"value":33303,"limit":2097152},"expansiondepth":{"value":20,"limit":40},"expensivefunctioncount":{"value":3,"limit":500},"unstrip-depth":{"value":1,"limit":20},"unstrip-size":{"value":133728,"limit":5000000},"entityaccesscount":{"value":1,"limit":400},"timingprofile":["100.00% 932.623 1 -total"," 28.29% 263.822 1 Template:Reflist"," 23.09% 215.325 53 Template:Cite_web"," 11.52% 107.484 1 Template:USCongDistStateCO"," 11.49% 107.179 175 Template:United_States_political_party_color"," 11.39% 106.202 73 Template:Election_box_candidate_with_party_link_no_change"," 11.24% 104.799 1 Template:USCongDistState"," 10.83% 101.007 1 Template:Navbox"," 9.05% 84.430 1 Template:Infobox_U.S._congressional_district"," 7.99% 74.526 2 Template:USCongDistStateList"]},"scribunto":{"limitreport-timeusage":{"value":"0.337","limit":"10.000"},"limitreport-memusage":{"value":5972034,"limit":52428800}},"cachereport":{"origin":"mw1322","timestamp":"20190107235550","ttl":1900800,"transientcontent":false}}});});{"@context":"https://schema.org","@type":"Article","name":"Colorado's 4th congressional district","url":"https://en.wikipedia.org/wiki/Colorado%27s_4th_congressional_district","sameAs":"http://www.wikidata.org/entity/Q5148664","mainEntity":"http://www.wikidata.org/entity/Q5148664","author":{"@type":"Organization","name":"Contributors to Wikimedia projects"},"publisher":{"@type":"Organization","name":"Wikimedia Foundation, Inc.","logo":{"@type":"ImageObject","url":"https://www.wikimedia.org/static/images/wmf-hor-googpub.png"}},"datePublished":"2006-04-02T20:53:34Z","dateModified":"2018-12-27T16:18:00Z","image":"https://upload.wikimedia.org/wikipedia/commons/d/d0/Colorado_US_Congressional_District_4_%28since_2013%29.tif"}(window.RLQ=window.RLQ||).push(function(){mw.config.set({"wgBackendResponseTime":1447,"wgHostname":"mw1322"});});


