Colorado's 3rd congressional district
Colorado's 3rd congressional district
Jump to navigation
Jump to search
| Colorado's 3rd congressional district | |
|---|---|
 Colorado's 3rd congressional district - since January 3, 2013. | |
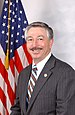
| U.S. Representative | Scott Tipton (R–Cortez) |
| Distribution |
|
| Population (2016) | 738,119[2] |
| Median income | $52,765[3] |
| Ethnicity |
|
| Cook PVI | R+6[4] |
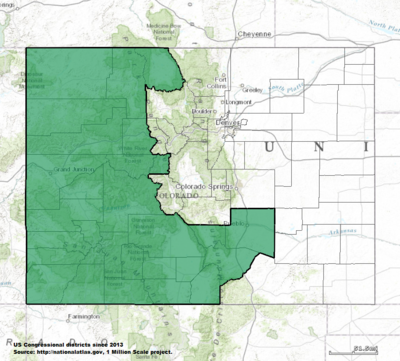
Colorado's 3rd congressional district is a congressional district in the U.S. state of Colorado. The district takes in most of the rural Western Slope in the state's western third, with a tendril in the south taking in the southern portions of the Eastern Plains. It includes the cities of Grand Junction, Durango and Pueblo.
The district is currently represented by Republican Scott R. Tipton, who defeated Democratic incumbent John Salazar in 2010.
The district is mainly rural and Republican (though not as much as the neighboring 4th district); however, there is some Democratic support in tourist counties and Pueblo, keeping the seat somewhat competitive.
.mw-parser-output .toclimit-2 .toclevel-1 ul,.mw-parser-output .toclimit-3 .toclevel-2 ul,.mw-parser-output .toclimit-4 .toclevel-3 ul,.mw-parser-output .toclimit-5 .toclevel-4 ul,.mw-parser-output .toclimit-6 .toclevel-5 ul,.mw-parser-output .toclimit-7 .toclevel-6 ul{display:none}
Contents
1 History
1.1 1990s
1.2 2000s
2 Characteristics
3 Voting
4 List of representatives
5 Election results
5.1 1914
5.2 1916
5.3 1918
5.4 1920
5.5 1922
5.6 1924
5.7 1926
5.8 1928
5.9 1930
5.10 1932
5.11 1934
5.12 1936
5.13 1938
5.14 1940 (Special)
5.15 1940
5.16 1942
5.17 1944
5.18 1946
5.19 1948
5.20 1950
5.21 1952
5.22 1954
5.23 1956
5.24 1958
5.25 1960
5.26 1962
5.27 1964
5.28 1966
5.29 1968
5.30 1970
5.31 1972
5.32 1974
5.33 1976
5.34 1978
5.35 1980
5.36 1982
5.37 1984
5.38 1986
5.39 1988
5.40 1990
5.41 1992
5.42 1994
5.43 1996
5.44 1998
5.45 2000
5.46 2002
5.47 2004
5.48 2006
5.49 2008
5.50 2010
5.51 2012
5.52 2014
5.53 2016
6 Living former Members
7 Historical district boundaries
8 See also
9 References
History[edit]
1990s[edit]
Following the 1990 U.S. Census and associated realignment of Colorado congressional districts, the 3rd Congressional district consisted of Alamosa, Archuleta, Chaffee, Conejos, Costilla, Custer, Delta, Dolores, Eagle, Garfield, Grand, Gunnison, Hinsdale, Huerfano, Jackson, Lake, La Plata, Mesa, Mineral, Moffat, Montezuma, Montrose, Ouray, Park, Pitkin, Pueblo, Rio Blanco, Rio Grande, Routt, Saguache, San Juan, San Miguel and Summit counties, as well as portions of Douglas, Fremont, and Jefferson counties.
2000s[edit]
Following the 2000 U.S. Census and associated realignment of Colorado congressional districts, the 3rd Congressional district consisted of Alamosa, Archuleta, Conejos, Costilla, Custer, Delta, Dolores, Garfield, Gunnison, Hinsdale, Huerfano, Jackson, La Plata, Las Animas, Mesa, Mineral, Moffat, Montezuma, Montrose, Ouray, Pitkin, Pueblo, Rio Blanco, Rio Grande, Routt, Saguache, San Juan, and San Miguel counties and most of Otero County.
Characteristics[edit]
The district has two major population centers in Grand Junction and Pueblo. The two cities and their surrounding rural areas provide a competitive arena for congressional races. Grand Junction, on the Western Slope, is a Republican stronghold while Pueblo, a town with a large Latino population and (by Colorado norms) a heavily unionized workforce, provides a base of support for Democrats. The district leaned heavily Republican in the 1990s, but in recent years has become more competitive.
George W. Bush received 55% of the vote in the district in 2004 while John McCain won the district in 2008 50%–47%.
Voting[edit]
Election results from presidential races[5]
| Election results from presidential races | ||
|---|---|---|
| Year | Office | Results |
| 2000 | President | Bush 54 - 39% |
| 2004 | President | Bush 55 - 44% |
| 2008 | President | McCain 50 - 47% |
| 2012 | President | Romney 52 - 46% |
| 2016 | President | Trump 52 – 40% |
List of representatives[edit]
| Representative | Party | Term Duration | District Home | Electoral history |
|---|---|---|---|---|
| District created March 4, 1915 Districts 3 and 4 were created from the former at-large district | ||||
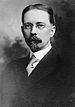
 Edward Keating Edward Keating | Democratic | March 4, 1915 – March 3, 1919 | Pueblo | First elected in 1912 (At-large district) Lost re-election |
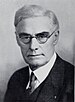
 Guy Urban Hardy Guy Urban Hardy | Republican | March 4, 1919 – March 3, 1933 | Canon City | First elected in 1918 Lost re-election |
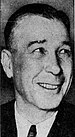
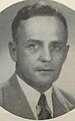
 John Andrew Martin John Andrew Martin | Democratic | March 4, 1933 – December 23, 1939 | Pueblo | First elected in 1932 Died |
Vacant | December 23, 1939 – November 5, 1940 | |||
 William Evans Burney William Evans Burney | Democratic | November 5, 1940 – January 3, 1941 | Pueblo | Won special election to finish remaining term Did not run as a candidate for a full term in the 1940 general election |
 J. Edgar Chenoweth J. Edgar Chenoweth | Republican | January 3, 1941– January 3, 1949 | Trinidad | First elected in 1940 Lost re-election |
 John Henry Marsalis John Henry Marsalis | Democratic | January 3, 1949 – January 3, 1951 | Pueblo | Elected in 1948 Lost re-election |
| J. Edgar Chenoweth | Republican | January 3, 1951 – January 3, 1965 | Trinidad | Re-elected in 1950 Lost party re-nomination |
 Frank Evans Frank Evans | Democratic | January 3, 1965 – January 3, 1979 | Beulah | First elected in 1964 Retired |
 Ray Kogovsek Ray Kogovsek | Democratic | January 3, 1979 – January 3, 1985 | Pueblo | First elected in 1978 Retired |
 Mike Strang Mike Strang | Republican | January 3, 1985 – January 3, 1987 | Carbondale | Elected in 1984 Lost re-election |
 Ben Nighthorse Campbell Ben Nighthorse Campbell | Democratic | January 3, 1987 – January 3, 1993 | Ignacio | First elected in 1986 Retired to run for U.S. Senate |
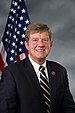
 Scott McInnis Scott McInnis | Republican | January 3, 1993 – January 3, 2005 | Glenwood Springs | First elected in 1992 Retired |
 John Salazar John Salazar | Democratic | January 3, 2005 – January 3, 2011 | Manassa | First elected in 2004 Lost re-election |
 Scott Tipton Scott Tipton | Republican | January 3, 2011 – present | Cortez | First elected in 2010 |
Election results[edit]
1914 • 1916 • 1918 • 1920 • 1922 • 1924 • 1926 • 1928 • 1930 • 1932 • 1934 • 1936 • 1938 • |
1914[edit]
| Party | Candidate | Votes | % | ||
|---|---|---|---|---|---|
Democratic | Edward Keating | 37,191 | 53% | ||
Republican | Neil N. McLean | 32,567 | 47% | ||
| Total votes | 69,758 | 100% | |||
Democratic win (new seat) | |||||
1916[edit]
| Party | Candidate | Votes | % | |
|---|---|---|---|---|
Democratic | Edward Keating (incumbent) | 40,183 | 54% | |
Republican | George E. McClelland | 31,137 | 42% | |
Socialist | David McGrew | 2,492 | 3% | |
Progressive | William G. Francis | 443 | 1% | |
| Total votes | 74,255 | 100% | ||
Democratic hold | ||||
1918[edit]
| Party | Candidate | Votes | % | |||
|---|---|---|---|---|---|---|
Republican | Guy U. Hardy | 31,715 | 51% | |||
Democratic | Edward Keating (incumbent) | 29,075 | 47% | |||
Socialist | Edith Halcomb | 1,453 | 2% | |||
| Total votes | 62,243 | 100% | ||||
Republican gain from Democratic | ||||||
1920[edit]
| Party | Candidate | Votes | % | |
|---|---|---|---|---|
Republican | Guy U. Hardy (incumbent) | 43,426 | 58% | |
Democratic | Samuel J. Burris | 31,896 | 42% | |
| Total votes | 75,322 | 100% | ||
Republican hold | ||||
1922[edit]
| Party | Candidate | Votes | % | |
|---|---|---|---|---|
Republican | Guy U. Hardy (incumbent) | 43,508 | 52% | |
Democratic | Chester B. Horn | 39,500 | 48% | |
| Total votes | 83,008 | 100% | ||
Republican hold | ||||
1924[edit]
| Party | Candidate | Votes | % | |
|---|---|---|---|---|
Republican | Guy U. Hardy (incumbent) | 53,877 | 59% | |
Democratic | Charles B. Hughes | 37,976 | 41% | |
| Total votes | 91,853 | 100% | ||
Republican hold | ||||
1926[edit]
| Party | Candidate | Votes | % | |
|---|---|---|---|---|
Republican | Guy U. Hardy (incumbent) | 46,916 | 54% | |
Democratic | Edmond I. Crockett | 40,009 | 46% | |
| Total votes | 86,925 | 100% | ||
Republican hold | ||||
1928[edit]
| Party | Candidate | Votes | % | |
|---|---|---|---|---|
Republican | Guy U. Hardy (incumbent) | 64,116 | 65% | |
Democratic | Harry A. McIntyre | 34,670 | 35% | |
| Total votes | 98,786 | 100% | ||
Republican hold | ||||
1930[edit]
| Party | Candidate | Votes | % | |
|---|---|---|---|---|
Republican | Guy U. Hardy (incumbent) | 55,170 | 61% | |
Democratic | Guy M. Weybright | 35,744 | 39% | |
| Total votes | 90,914 | 100% | ||
Democratic hold | ||||
1932[edit]
| Party | Candidate | Votes | % | |||
|---|---|---|---|---|---|---|
Democratic | John Andrew Martin | 59,882 | 51% | |||
Republican | Guy U. Hardy (incumbent) | 57,793 | 49% | |||
| Total votes | 117,675 | 100% | ||||
Democratic gain from Republican | ||||||
1934[edit]
| Party | Candidate | Votes | % | |
|---|---|---|---|---|
Democratic | John Andrew Martin (incumbent) | 73,281 | 64% | |
Republican | W.O. Peterson | 39,753 | 35% | |
Socialist | Joseph T. Landis | 1,199 | 1% | |
| Total votes | 114,233 | 100% | ||
Democratic hold | ||||
1936[edit]
| Party | Candidate | Votes | % | |
|---|---|---|---|---|
Democratic | John Andrew Martin (incumbent) | 74,013 | 60% | |
Republican | J. Arthur Phelps | 48,871 | 40% | |
| Total votes | 122,884 | 100% | ||
Democratic hold | ||||
1938[edit]
| Party | Candidate | Votes | % | |
|---|---|---|---|---|
Democratic | John Andrew Martin (incumbent) | 72,736 | 57% | |
Republican | Henry Leonard | 54,007 | 43% | |
| Total votes | 126,743 | 100% | ||
Democratic hold | ||||
1940 (Special)[edit]
| Party | Candidate | Votes | % | |
|---|---|---|---|---|
Democratic | William E. Burney | 68,225 | 51% | |
Republican | Henry Leonard | 65,675 | 49% | |
| Total votes | 133,900 | 100% | ||
Democratic hold | ||||
1940[edit]
| Party | Candidate | Votes | % | |||
|---|---|---|---|---|---|---|
Republican | John Chenoweth | 70,842 | 52% | |||
Democratic | Byron G. Rogers | 65,269 | 48% | |||
| Total votes | 136,111 | 100% | ||||
Republican gain from Democratic | ||||||
1942[edit]
| Party | Candidate | Votes | % | |
|---|---|---|---|---|
Republican | John Chenoweth (incumbent) | 55,838 | 63% | |
Democratic | J.C. Jarrett | 33,154 | 37% | |
| Total votes | 88,992 | 100% | ||
Republican hold | ||||
1944[edit]
| Party | Candidate | Votes | % | |
|---|---|---|---|---|
Republican | John Chenoweth (incumbent) | 69,492 | 56% | |
Democratic | Arthur M. Wimmell | 53,904 | 44% | |
| Total votes | 123,396 | 100% | ||
Republican hold | ||||
1946[edit]
| Party | Candidate | Votes | % | |
|---|---|---|---|---|
Republican | John Chenoweth (incumbent) | 45,043 | 55% | |
Democratic | Walter Walford Johnson | 37,496 | 45% | |
| Total votes | 82,539 | 100% | ||
Republican hold | ||||
1948[edit]
| Party | Candidate | Votes | % | |||
|---|---|---|---|---|---|---|
Democratic | John H. Marsalis | 65,114 | 51% | |||
Republican | John Chenoweth (incumbent) | 63,312 | 49% | |||
| Total votes | 128,426 | 100% | ||||
Democratic gain from Republican | ||||||
1950[edit]
| Party | Candidate | Votes | % | |||
|---|---|---|---|---|---|---|
Republican | John Chenoweth | 58,831 | 52% | |||
Democratic | John H. Marsalis (incumbent) | 55,110 | 48% | |||
| Total votes | 113,941 | 100% | ||||
Republican gain from Democratic | ||||||
1952[edit]
| Party | Candidate | Votes | % | |
|---|---|---|---|---|
Republican | John Chenoweth (incumbent) | 84,739 | 58% | |
Democratic | John H. Marsalis | 62,025 | 42% | |
| Total votes | 146,764 | 100% | ||
Republican hold | ||||
1954[edit]
| Party | Candidate | Votes | % | |
|---|---|---|---|---|
Republican | John Chenoweth (incumbent) | 62,884 | 53% | |
Democratic | Alva B. Adams, Jr. | 55,750 | 47% | |
| Total votes | 118,634 | 100% | ||
Republican hold | ||||
1956[edit]
| Party | Candidate | Votes | % | |
|---|---|---|---|---|
Republican | John Chenoweth (incumbent) | 74,196 | 50% | |
Democratic | Alva B. Adams, Jr. | 73,501 | 50% | |
| Total votes | 147,697 | 100% | ||
Republican hold | ||||
1958[edit]
| Party | Candidate | Votes | % | |
|---|---|---|---|---|
Republican | John Chenoweth (incumbent) | 63,655 | 50% | |
Democratic | Fred M. Betz | 63,112 | 50% | |
| Total votes | 126,767 | 100% | ||
Republican hold | ||||
1960[edit]
| Party | Candidate | Votes | % | |
|---|---|---|---|---|
Republican | John Chenoweth (incumbent) | 85,825 | 52% | |
Democratic | Franklin R. Stewart | 79,069 | 48% | |
| Total votes | 164,894 | 100% | ||
Republican hold | ||||
1962[edit]
| Party | Candidate | Votes | % | |
|---|---|---|---|---|
Republican | John Chenoweth (incumbent) | 74,848 | 55% | |
Democratic | Albert "Al" Tomsic | 62,097 | 45% | |
| Total votes | 136,945 | 100% | ||
Republican hold | ||||
1964[edit]
| Party | Candidate | Votes | % | |||
|---|---|---|---|---|---|---|
Democratic | Frank Evans | 85,404 | 51% | |||
Republican | John Chenoweth (incumbent) | 81,544 | 49% | |||
| Total votes | 166,948 | 100% | ||||
Democratic gain from Republican | ||||||
1966[edit]
| Party | Candidate | Votes | % | |
|---|---|---|---|---|
Democratic | Frank Evans (incumbent) | 76,270 | 52% | |
Republican | David W. Enoch | 71,213 | 48% | |
| Total votes | 147,483 | 100% | ||
Democratic hold | ||||
1968[edit]
| Party | Candidate | Votes | % | |
|---|---|---|---|---|
Democratic | Frank Evans (incumbent) | 88,368 | 52% | |
Republican | Paul Bradley | 81,163 | 48% | |
| Total votes | 169,531 | 100% | ||
Democratic hold | ||||
1970[edit]
| Party | Candidate | Votes | % | |
|---|---|---|---|---|
Democratic | Frank Evans (incumbent) | 87,000 | 64% | |
Republican | John "Jack" Mitchell, Jr. | 45,610 | 33% | |
Raza Unida | Martin P. Serna | 1,828 | 1% | |
| Peace Independent | Walter Cranson | 1,598 | 1% | |
American Independent | Henry John Olshaw | 652 | 1% | |
| Total votes | 136,688 | 100% | ||
Democratic hold | ||||
1972[edit]
| Party | Candidate | Votes | % | |
|---|---|---|---|---|
Democratic | Frank Evans (incumbent) | 107,511 | 66% | |
Republican | Chuck Brady | 54,556 | 34% | |
| Total votes | 162,067 | 100% | ||
Democratic hold | ||||
1974[edit]
| Party | Candidate | Votes | % | |
|---|---|---|---|---|
Democratic | Frank Evans (incumbent) | 91,783 | 68% | |
Republican | E. Keith Records | 43,298 | 32% | |
| Total votes | 135,081 | 100% | ||
Democratic hold | ||||
1976[edit]
| Party | Candidate | Votes | % | |
|---|---|---|---|---|
Democratic | Frank Evans (incumbent) | 89,302 | 51% | |
Republican | Melvin Takaki | 82,315 | 47% | |
Raza Unida | Alfredo Archer | 2,429 | 1% | |
American Independent | Henry John Olshaw | 1,186 | 1% | |
| Total votes | 175,232 | 100% | ||
Democratic hold | ||||
1978[edit]
| Party | Candidate | Votes | % | |
|---|---|---|---|---|
Democratic | Raymond P. Kogovsek | 69,669 | 49% | |
Republican | Harold L. McCormick | 69,303 | 49% | |
American Independent | Henry John Olshaw | 2,475 | 2% | |
| Total votes | 141,447 | 100% | ||
Democratic hold | ||||
1980[edit]
| Party | Candidate | Votes | % | |
|---|---|---|---|---|
Democratic | Raymond P. Kogovsek (incumbent) | 105,820 | 55% | |
Republican | Harold L. McCormick | 84,292 | 44% | |
Libertarian | James S. Glennie | 2,670 | 1% | |
| Total votes | 192,782 | 100% | ||
Democratic hold | ||||
1982[edit]
| Party | Candidate | Votes | % | |
|---|---|---|---|---|
Democratic | Raymond P. Kogovsek (incumbent) | 92,384 | 53% | |
Republican | Tom Wiena | 77,409 | 45% | |
Libertarian | Paul "Stormy" Mohn | 2,439 | 1% | |
Independent | Henry John Olshaw | 656 | 1% | |
| Total votes | 172,888 | 100% | ||
Democratic hold | ||||
1984[edit]
| Party | Candidate | Votes | % | |||
|---|---|---|---|---|---|---|
Republican | Michael L. Strang | 122,669 | 57% | |||
Democratic | W. Mitchell | 90,963 | 42% | |||
Libertarian | Robert Jahelka | 1,358 | 0.5% | |||
Independent | Henry John Olshaw | 880 | 0.5% | |||
| Total votes | 215,870 | 100% | ||||
Republican gain from Democratic | ||||||
1986[edit]
| Party | Candidate | Votes | % | |||
|---|---|---|---|---|---|---|
Democratic | Ben Nighthorse Campbell | 95,353 | 52% | |||
Republican | Michael L. Strang (incumbent) | 88,508 | 48% | |||
| Total votes | 183,861 | 100% | ||||
Democratic gain from Republican | ||||||
1988[edit]
| Party | Candidate | Votes | % | |
|---|---|---|---|---|
Democratic | Ben Nighthorse Campbell (incumbent) | 169,284 | 78% | |
Republican | Jim Zartman | 47,625 | 22% | |
| Total votes | 216,909 | 100% | ||
Democratic hold | ||||
1990[edit]
| Party | Candidate | Votes | % | |
|---|---|---|---|---|
Democratic | Ben Nighthorse Campbell (incumbent) | 124,487 | 70% | |
Republican | Bob Ellis | 49,961 | 28% | |
Populist ('84-'96) | Howard E. Fields | 2,859 | 2% | |
| Total votes | 177,307 | 100% | ||
Democratic hold | ||||
1992[edit]
| Party | Candidate | Votes | % | |||
|---|---|---|---|---|---|---|
Republican | Scott McInnis | 143,293 | 55% | |||
Democratic | Mike Callihan | 114,480 | 44% | |||
Populist ('84-'96) | Ki R. Nelson | 4,189 | 1% | |||
| Total votes | 261,962 | 100% | ||||
Republican gain from Democratic | ||||||
1994[edit]
| Party | Candidate | Votes | % | |
|---|---|---|---|---|
Republican | Scott McInnis (incumbent) | 145,365 | 70% | |
Democratic | Linda Powers | 63,427 | 30% | |
| Total votes | 208,792 | 100% | ||
Republican hold | ||||
1996[edit]
| Party | Candidate | Votes | % | |
|---|---|---|---|---|
Republican | Scott McInnis (incumbent) | 183,523 | 69% | |
Democratic | Albert Gurule | 82,953 | 31% | |
| Total votes | 266,476 | 100% | ||
Republican hold | ||||
1998[edit]
| Party | Candidate | Votes | % | |
|---|---|---|---|---|
Republican | Scott McInnis (incumbent) | 156,501 | 66% | |
Democratic | Robert Reed Kelley | 74,479 | 32% | |
Libertarian | Barry Baggert | 5,673 | 2% | |
| Total votes | 236,653 | 100% | ||
Republican hold | ||||
2000[edit]
| Party | Candidate | Votes | % | |
|---|---|---|---|---|
Republican | Scott McInnis (incumbent) | 199,204 | 66% | |
Democratic | Curtis Imrie | 87,921 | 29% | |
Libertarian | Drew Sakson | 9,982 | 3% | |
Reform | Victor A. Good | 5,433 | 2% | |
| Total votes | 302,540 | 100% | ||
Republican hold | ||||
2002[edit]
| Party | Candidate | Votes | % | |
|---|---|---|---|---|
Republican | Scott McInnis (incumbent) | 143,433 | 66% | |
Democratic | Dennis Berckefeldt | 68,160 | 31% | |
Libertarian | J. Brent Shroyer | 4,370 | 2% | |
Natural Law | Gary W. Swing | 1,903 | 0.5% | |
| Write-in | Jason Alessio | 106 | 0.05 | |
| Total votes | 217,972 | 100% | ||
Republican hold | ||||
2004[edit]
| Party | Candidate | Votes | % | |||
|---|---|---|---|---|---|---|
Democratic | John Salazar | 153,500 | 51% | |||
Republican | Greg Walcher | 141,376 | 47% | |||
| Unaffiliated | Jim Krug | 8,770 | 2% | |||
| Total votes | 303,646 | 100% | ||||
Democratic gain from Republican | ||||||
2006[edit]
| Party | Candidate | Votes | % | |
|---|---|---|---|---|
Democratic | John Salazar (incumbent) | 146,488 | 62% | |
Republican | Scott Tipton | 86,930 | 37% | |
Libertarian | Bert L. Sargent | 4,417 | 0.5% | |
Green | Bruce E. Lohmiller (as a write-in) | 23 | 0.5% | |
| Total votes | 237,858 | 100% | ||
Democratic hold | ||||
2008[edit]
| Party | Candidate | Votes | % | |
|---|---|---|---|---|
Democratic | John Salazar (incumbent) | 203,457 | 62% | |
Republican | Wayne Wolf | 126,762 | 38% | |
| Total votes | 330,219 | 100% | ||
Democratic hold | ||||
2010[edit]
| Party | Candidate | Votes | % | |||
|---|---|---|---|---|---|---|
Republican | Scott Tipton | 129,257 | 50% | |||
Democratic | John Salazar (incumbent) | 118,048 | 46% | |||
Libertarian | Gregory Gilman | 5,678 | 2% | |||
Independent | Jake Segrest | 4,982 | 2% | |||
| Write-in | John W. Hargis, Sr. | 23 | 0.00 | |||
| Write-in | Jim Fritz | 11 | 0.00 | |||
| Total votes | 257,999 | 100% | ||||
Republican gain from Democratic | ||||||
2012[edit]
| Party | Candidate | Votes | % | |
|---|---|---|---|---|
Republican | Scott Tipton (incumbent) | 185,291 | 53% | |
Democratic | Sal Pace | 142,619 | 41% | |
Independent | Tisha Casida | 11,125 | 3% | |
Libertarian | Gregory Gilman | 4,982 | 3% | |
| Total votes | 347,247 | 100% | ||
Republican hold | ||||
2014[edit]
| Party | Candidate | Votes | % | |
|---|---|---|---|---|
Republican | Scott Tipton (incumbent) | 163,011 | 58% | |
Democratic | Abel Tapia | 100,364 | 36% | |
Independent | Tisha Casida | 11,294 | 4% | |
Libertarian | Travis Mero | 6,472 | 2% | |
| Total votes | 281,143 | 100% | ||
Republican hold | ||||
2016[edit]
| Party | Candidate | Votes | % | |
|---|---|---|---|---|
Republican | Scott Tipton (Incumbent) | 204,220 | 54.60% | |
Democratic | Gail Schwartz | 150,914 | 40.35% | |
Libertarian | Gaylon Kent | 18,903 | 5.05% | |
| Total votes | 374,037 | 100% | ||
Republican hold | ||||
Living former Members[edit]
As of May 2017[update], there are three former members of the U.S. House of Representatives from Colorado's 3rd congressional district who are currently living at this time. The most recent representative to die was Ray Kogovsek (1979-1985) on April 30, 2017.
| Representative | Term of office | Date of birth (and age) |
|---|---|---|
Ben Nighthorse Campbell | 1987–1993 | (1933-04-13) April 13, 1933 |
Scott McInnis | 1993–2005 | (1953-05-09) May 9, 1953 |
John Salazar | 2005–2011 | (1953-07-21) July 21, 1953 |
Historical district boundaries[edit]

2003 - 2013
See also[edit]
- Colorado's congressional districts
- List of United States congressional districts
References[edit]
Martis, Kenneth C. (1989). The Historical Atlas of Political Parties in the United States Congress. New York: Macmillan Publishing Company..mw-parser-output cite.citation{font-style:inherit}.mw-parser-output q{quotes:"""""""'""'"}.mw-parser-output code.cs1-code{color:inherit;background:inherit;border:inherit;padding:inherit}.mw-parser-output .cs1-lock-free a{background:url("//upload.wikimedia.org/wikipedia/commons/thumb/6/65/Lock-green.svg/9px-Lock-green.svg.png")no-repeat;background-position:right .1em center}.mw-parser-output .cs1-lock-limited a,.mw-parser-output .cs1-lock-registration a{background:url("//upload.wikimedia.org/wikipedia/commons/thumb/d/d6/Lock-gray-alt-2.svg/9px-Lock-gray-alt-2.svg.png")no-repeat;background-position:right .1em center}.mw-parser-output .cs1-lock-subscription a{background:url("//upload.wikimedia.org/wikipedia/commons/thumb/a/aa/Lock-red-alt-2.svg/9px-Lock-red-alt-2.svg.png")no-repeat;background-position:right .1em center}.mw-parser-output .cs1-subscription,.mw-parser-output .cs1-registration{color:#555}.mw-parser-output .cs1-subscription span,.mw-parser-output .cs1-registration span{border-bottom:1px dotted;cursor:help}.mw-parser-output .cs1-hidden-error{display:none;font-size:100%}.mw-parser-output .cs1-visible-error{font-size:100%}.mw-parser-output .cs1-subscription,.mw-parser-output .cs1-registration,.mw-parser-output .cs1-format{font-size:95%}.mw-parser-output .cs1-kern-left,.mw-parser-output .cs1-kern-wl-left{padding-left:0.2em}.mw-parser-output .cs1-kern-right,.mw-parser-output .cs1-kern-wl-right{padding-right:0.2em}
Martis, Kenneth C. (1982). The Historical Atlas of United States Congressional Districts. New York: Macmillan Publishing Company.
- Congressional Biographical Directory of the United States 1774–present
^ https://www.census.gov/geo/maps-data/data/cd_state.html
^ https://www.census.gov/mycd/?st=08&cd=03
^ https://www.census.gov/mycd/?st=08&cd=03
^ "Partisan Voting Index – Districts of the 115th Congress" (PDF). The Cook Political Report. April 7, 2017. Retrieved April 7, 2017.
^ Presidential Election Results, by district, swingstateproject.com
^ 1914 Election Results
^ 1916 Election Results
^ 1918 Election Results
^ 1920 Election Results
^ 1922 Election Results
^ 1924 Election Results
^ 1926 Election Results
^ 1928 Election Results
^ 1930 Election Results
^ 1932 Election Results
^ 1934 Election Results
^ 1936 Election Results
^ 1938 Election Results
^ 1940 Special Election Results
^ 1940 Election Results
^ 1942 Election Results
^ 1944 Election Results
^ 1946 Election Results
^ 1948 Election Results
^ 1950 Election Results
^ 1952 Election Results
^ 1954 Election Results
^ 1956 Election Results
^ 1958 Election Results
^ 1960 Election Results
^ 1962 Election Results
^ 1964 Election Results
^ 1966 Election Results
^ 1968 Election Results
^ 1970 Election Results
^ 1972 Election Results
^ 1974 Election Results
^ 1976 Election Results
^ 1978 Election Results
^ 1980 Election Results
^ 1982 Election Results
^ 1984 Election Results
^ 1986 Election Results
^ 1988 Election Results
^ 1990 Election Results
^ 1992 Election Results
^ 1994 Election Results
^ 1996 Election Results
^ 1998 Election Results
^ 2000 Election Results
^ 2002 Election Results
^ 2004 Election Results
^ 2006 Election Results
^ 2008 Election Results
^ 2010 Election Results
^ 2012 Election Results
^ 2014 Election Results
^ 2016 Election Results
Coordinates: 38°44′36″N 107°20′42″W / 38.74333°N 107.34500°W / 38.74333; -107.34500
Categories:
- Congressional districts of Colorado
- Colorado Western Slope
- San Luis Valley of Colorado
(window.RLQ=window.RLQ||).push(function(){mw.config.set({"wgPageParseReport":{"limitreport":{"cputime":"1.048","walltime":"1.272","ppvisitednodes":{"value":28072,"limit":1000000},"ppgeneratednodes":{"value":0,"limit":1500000},"postexpandincludesize":{"value":151938,"limit":2097152},"templateargumentsize":{"value":34698,"limit":2097152},"expansiondepth":{"value":20,"limit":40},"expensivefunctioncount":{"value":4,"limit":500},"unstrip-depth":{"value":1,"limit":20},"unstrip-size":{"value":27362,"limit":5000000},"entityaccesscount":{"value":1,"limit":400},"timingprofile":["100.00% 819.497 1 -total"," 16.81% 137.766 83 Template:Election_box_candidate_with_party_link_no_change"," 14.47% 118.590 179 Template:United_States_political_party_color"," 12.67% 103.847 1 Template:USCongDistStateCO"," 12.26% 100.500 1 Template:USCongDistState"," 11.71% 95.955 1 Template:Navbox"," 10.50% 86.084 1 Template:Infobox_U.S._congressional_district"," 9.97% 81.709 81 Template:Republican_Party_(United_States)/meta/color"," 9.43% 77.295 2 Template:Cite_book"," 8.77% 71.860 2 Template:USCongDistStateList"]},"scribunto":{"limitreport-timeusage":{"value":"0.153","limit":"10.000"},"limitreport-memusage":{"value":4717695,"limit":52428800}},"cachereport":{"origin":"mw1300","timestamp":"20190102005226","ttl":1900800,"transientcontent":false}}});mw.config.set({"wgBackendResponseTime":104,"wgHostname":"mw1241"});});


