Litchfield County, Connecticut
Litchfield County, Connecticut | |
|---|---|
| County of Connecticut | |
| County of Litchfield | |
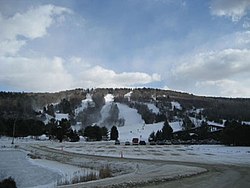 Mohawk Mountain Ski Area in Cornwall. | |
 Location within the U.S. state of Connecticut | |
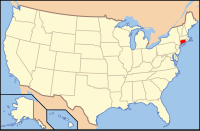 Connecticut's location within the U.S. | |
| Founded | 1751 |
| Seat | none (since 1960) Litchfield (before 1960) |
| Largest city | Torrington |
| Area | |
| • Total | 945 sq mi (2,448 km2) |
| • Land | 921 sq mi (2,385 km2) |
| • Water | 24 sq mi (62 km2), 2.5% |
| Population (est.) | |
| • (2017) | 182,177 |
| • Density | 194/sq mi (75/km2) |
| Congressional districts | 1st, 5th |
| Time zone | Eastern: UTC−5/−4 |
Litchfield County is located in northwestern Connecticut in the New York metropolitan area. As of the 2010 census, the population was 189,927.[1] The county was named after Lichfield, in England.[2] Litchfield County has the lowest population density of any county in Connecticut and is geographically the state's largest county.
Litchfield County comprises the Torrington, CT Micropolitan Statistical Area, which is included in the New York–Newark, NY–NJ–CT–PA Combined Statistical Area.
As is the case with the other seven Connecticut counties, there is no county government and no county seat. Each town is responsible for all local services such as schools, snow removal, sewers, and fire and police departments. However, in some cases in rural areas, adjoining towns may agree to jointly provide services or even establish a joint school system.
Contents
1 History
2 Geography
2.1 Adjacent counties
3 Demographics
3.1 2000 census
3.2 2010 census
3.3 Demographic breakdown by town
3.3.1 Income
3.3.2 Race
4 Politics
5 Transportation
6 Communities
6.1 City
6.2 Towns
6.3 Telephone area codes
7 Attractions
8 See also
9 References
10 External links
History
Litchfield County was created on October 9, 1751, by an act of the Connecticut General Court from land belonging to Fairfield, New Haven, and Hartford counties. The act establishing the county states:
That the townships of Litchfield, Woodbury, New Milford, Harwinton, New Hartford, Barkhempstead, Hartland, Colebrook, Norfolk, Canaan, Salisbury, Kent, Sharon, Cornwall, Goshen, Torrington, and Winchester, lying in the northwesterly part of this Colony, shall be and remain one entire county, and be called the County of Litchfield, and shall have and exercise the same powers, priviledges [sic] and authorities, and be subject to the same regulations, as the other counties in this Colony by law have and are subject unto. The bounds of which county shall extend north to the Colony line, and west to the
Colony line till it meets with the township of New Fairfield, and to include the towns abovementioned.[3]
Between 1780 and 1807, several new towns were created at the boundaries between Litchfield County and other counties in Connecticut. The town of Watertown was established in 1780 from Waterbury and was placed under Litchfield County jurisdiction. The establishment of the town of Brookfield from part of New Milford in 1788 resulted in Litchfield County losing territory to Fairfield County. In 1796, the town of Hartland was transferred to Hartford County. In 1798, the town of Oxford was established from part of Southbury causing Litchfield County to lose territory to New Haven County. In 1807, the town of Southbury was transferred to New Haven County. The final boundary change occurred on October 8, 1807, when the town of Middlebury was established from part of Woodbury.[4]
In 1862, during the Civil War, Litchfield County raised the 2nd Connecticut Regiment of Volunteers Heavy Artillery. This regiment, originally the 19th Connecticut Volunteer Infantry, served in the defense of Washington, D.C. from September 1862 to March 1864, at which time it was transferred to the Army of the Potomac. On June 1, 1864, the 2nd Connecticut Heavy Artillery fought as infantry (as it continued to do through the war) in the Battle of Cold Harbor, experiencing the heaviest proportionate losses of any Connecticut regiment in the Civil War. The regiment remained active to the end of the war, and its final mustering out September 5, 1865.[5]
Geography
According to the U.S. Census Bureau, the county has a total area of 945 square miles (2,450 km2), of which 921 square miles (2,390 km2) is land and 24 square miles (62 km2) (2.5%) is water.[6] It is the largest county in Connecticut by area. Litchfield County is roughly contiguous with the portion of the Appalachian Mountains range known as the Berkshire Mountains (sometimes locally, this area is called the Litchfield Hills).
Adjacent counties
Berkshire County, Massachusetts (north)
Hampden County, Massachusetts (northeast)
Hartford County (east)
New Haven County (southeast)
Fairfield County (south)
Dutchess County, New York (west)
Demographics
| Historical population | |||
|---|---|---|---|
| Census | Pop. | %± | |
| 1790 | 38,635 | — | |
| 1800 | 41,214 | 6.7% | |
| 1810 | 41,375 | 0.4% | |
| 1820 | 41,267 | −0.3% | |
| 1830 | 42,858 | 3.9% | |
| 1840 | 40,448 | −5.6% | |
| 1850 | 45,253 | 11.9% | |
| 1860 | 47,318 | 4.6% | |
| 1870 | 48,727 | 3.0% | |
| 1880 | 52,044 | 6.8% | |
| 1890 | 53,542 | 2.9% | |
| 1900 | 63,672 | 18.9% | |
| 1910 | 70,260 | 10.3% | |
| 1920 | 76,262 | 8.5% | |
| 1930 | 82,556 | 8.3% | |
| 1940 | 87,041 | 5.4% | |
| 1950 | 98,872 | 13.6% | |
| 1960 | 119,856 | 21.2% | |
| 1970 | 144,091 | 20.2% | |
| 1980 | 156,769 | 8.8% | |
| 1990 | 174,092 | 11.1% | |
| 2000 | 182,193 | 4.7% | |
| 2010 | 189,927 | 4.2% | |
| Est. 2017 | 182,177 | [7] | −4.1% |
| U.S. Decennial Census[8] 1790-1960[9] 1900-1990[10] 1990-2000[11] 2010-2016[1] | |||
2000 census
As of the census[12] of 2000, there were 182,193 people, 71,551 households, and 49,584 families residing in the county. The population density was 198 people per square mile (76/km²). There were 79,267 housing units at an average density of 86 per square mile (33/km²). The racial makeup of the county was 95.77% White, 1.10% Black or African American, 0.18% Native American, 1.17% Asian, 0.02% Pacific Islander, 0.68% from other races, and 1.09% from two or more races. 2.14% of the population were Hispanic or Latino of any race. 20.8% were of Italian, 14.8% Irish, 10.6% English, 9.2% German and 6.3% French ancestry. 92.3% spoke English, 2.1% Spanish, 1.6% Italian and 1.2% French as their first language.
There were 71,551 households out of which 32.10% had children under the age of 18 living with them, 57.20% were married couples living together, 8.60% had a female householder with no husband present, and 30.70% were non-families. 25.30% of all households were made up of individuals and 10.20% had someone living alone who was 65 years of age or older. The average household size was 2.51 and the average family size was 3.03.
In the county, the population was spread out with 24.60% under the age of 18, 5.70% from 18 to 24, 29.80% from 25 to 44, 25.70% from 45 to 64, and 14.20% who were 65 years of age or older. The median age was 40 years. For every 100 females, there were 95.60 males. For every 100 females age 18 and over, there were 92.50 males.
The median income for a household in the county was $56,273, and the median income for a family was $66,445 (these figures had risen to $67,591 and $81,752 respectively as of a 2007 estimate).[13] Males had a median income of $45,586 versus $31,870 for females. The per capita income for the county was $28,408. About 2.70% of families and 4.50% of the population were below the poverty line, including 4.30% of those under age 18 and 5.40% of those age 65 or over.
2010 census
As of the 2010 United States Census, there were 189,927 people, 76,640 households, and 51,530 families residing in the county.[14] The population density was 206.3 inhabitants per square mile (79.7/km2). There were 87,550 housing units at an average density of 95.1 per square mile (36.7/km2).[15] The racial makeup of the county was 93.9% white, 1.5% Asian, 1.3% black or African American, 0.2% American Indian, 1.4% from other races, and 1.6% from two or more races. Those of Hispanic or Latino origin made up 4.5% of the population.[14] In terms of ancestry, 23.0% were Italian, 21.3% were Irish, 14.8% were English, 14.5% were German, 8.3% were Polish, and 3.3% were American.[16]
Of the 76,640 households, 29.9% had children under the age of 18 living with them, 53.7% were married couples living together, 9.4% had a female householder with no husband present, 32.8% were non-families, and 26.6% of all households were made up of individuals. The average household size was 2.44 and the average family size was 2.97. The median age was 44.4 years.[14]
The median income for a household in the county was $69,639 and the median income for a family was $84,890. Males had a median income of $57,362 versus $42,729 for females. The per capita income for the county was $35,848. About 3.6% of families and 5.8% of the population were below the poverty line, including 6.9% of those under age 18 and 4.6% of those age 65 or over.[17]
Demographic breakdown by town
Income
Data is from the 2010 United States Census and the 2006-2010 American Community Survey 5-Year Estimates.[18][19]
| Rank | Town | Per capita income | Median household income | Median family income | Population | Number of households | |
|---|---|---|---|---|---|---|---|
| 1 | Roxbury | Town | $65,236 | $97,768 | $119,091 | 2,262 | 936 |
| 2 | Bridgewater | Town | $58,172 | $86,607 | $105,568 | 1,727 | 735 |
| 3 | Washington | Town | $51,907 | $67,417 | $84,833 | 3,578 | 1,512 |
| 4 | Kent | Town | $51,772 | $68,481 | $82,260 | 2,979 | 1,246 |
| 5 | Cornwall | Town | $50,901 | $80,179 | $97,500 | 1,420 | 628 |
| 6 | Warren | Town | $49,142 | $87,857 | $94,583 | 1,461 | 601 |
| 7 | Salisbury | Town | $47,361 | $63,587 | $76,719 | 3,741 | 1,693 |
| 8 | Woodbury | Town | $44,060 | $80,595 | $100,500 | 9,975 | 4,214 |
| 9 | Norfolk | Town | $43,866 | $85,526 | $98,098 | 1,709 | 720 |
| 10 | Sharon | Town | $43,317 | $70,104 | $74,313 | 2,782 | 1,250 |
| 11 | New Hartford | Town | $41,709 | $80,718 | $90,172 | 6,970 | 2,632 |
| 12 | Litchfield | Town | $41,649 | $78,750 | $100,833 | 8,466 | 3,459 |
| 13 | Litchfield | Borough | $40,635 | $68,125 | $81,875 | 1,258 | 548 |
| 14 | Bethlehem | Town | $39,704 | $82,899 | $86,792 | 3,607 | 1,411 |
| 15 | Goshen | Town | $39,562 | $76,705 | $86,114 | 2,976 | 1,192 |
| 16 | Colebrook | Town | $39,324 | $72,000 | $85,833 | 1,485 | 589 |
| 17 | New Milford | Town | $38,893 | $84,824 | $100,574 | 28,142 | 10,618 |
| 18 | Harwinton | Town | $37,902 | $85,253 | $92,083 | 5,642 | 2,170 |
| 19 | Canaan | Town | $37,283 | $54,219 | $77,500 | 1,234 | 583 |
| 20 | Morris | Town | $36,682 | $81,583 | $97,381 | 2,388 | 958 |
| 21 | Barkhamsted | Town | $34,775 | $87,656 | $107,804 | 3,799 | 1,452 |
| 22 | Watertown | Town | $34,158 | $77,771 | $93,194 | 22,514 | 8,672 |
| 23 | Thomaston | Town | $31,652 | $63,990 | $77,842 | 7,887 | 3,108 |
| 24 | Plymouth | Town | $30,081 | $71,630 | $82,438 | 12,243 | 4,803 |
| 25 | Winchester | Town | $27,264 | $57,958 | $68,622 | 11,242 | 4,815 |
| 26 | North Canaan | Town | $26,700 | $46,417 | $52,604 | 3,315 | 1,400 |
| 27 | Torrington | City | $25,948 | $48,409 | $64,476 | 36,383 | 15,243 |
| 28 | Winsted | City | $25,291 | $61,404 | $68,406 | 7,712 | 3,346 |
| 29 | Bantam | Borough | $24,284 | $42,256 | $54,063 | 759 | 372 |
Race
Data is from the 2007-2011 American Community Survey 5-Year Estimates, ACS Demographic and Housing Estimates, "Race alone or in combination with one or more other races."[20]
| Rank | Town | Population | White | Black | Asian | American Indian | Other | Hispanic | |
|---|---|---|---|---|---|---|---|---|---|
| 1 | Torrington | City | 36,380 | 93.6% | 3.5% | 2.9% | 1.1% | 1.8% | 6.8% |
| 2 | New Milford | Town | 28,122 | 92.6% | 3.9% | 2.7% | 0.6% | 1.8% | 5.2% |
| 3 | Watertown | Town | 22,502 | 96.1% | 1.6% | 2.2% | 0.6% | 0.9% | 2.5% |
| 4 | Plymouth | Town | 12,218 | 98.1% | 1.1% | 0.0% | 1.4% | 1.0% | 3.6% |
| 5 | Winchester | Town | 11,216 | 95.3% | 1.3% | 1.4% | 0.8% | 2.6% | 9.9% |
| 6 | Woodbury | Town | 9,928 | 97.9% | 0.6% | 1.8% | 0.7% | 0.3% | 4.0% |
| 7 | Litchfield | Town | 8,484 | 97.6% | 1.5% | 1.2% | 0.2% | 0.7% | 3.1% |
| 8 | Thomaston | Town | 7,862 | 98.0% | 1.2% | 0.9% | 1.0% | 0.7% | 1.4% |
| 9 | Winsted | City | 7,402 | 93.3% | 1.5% | 1.9% | 1.3% | 3.7% | 13.2% |
| 10 | New Hartford | Town | 6,901 | 96.0% | 0.6% | 3.9% | 0.0% | 0.0% | 0.7% |
| 11 | Harwinton | Town | 5,618 | 97.7% | 0.0% | 2.3% | 0.5% | 0.0% | 0.0% |
| 12 | Barkhamsted | Town | 3,783 | 99.8% | 0.4% | 0.2% | 0.0% | 0.0% | 0.3% |
| 13 | Salisbury | Town | 3,783 | 95.3% | 2.6% | 3.8% | 1.3% | 2.0% | 2.2% |
| 14 | Bethlehem | Town | 3,596 | 99.4% | 0.1% | 0.8% | 0.2% | 0.0% | 0.9% |
| 15 | Washington | Town | 3,586 | 94.0% | 2.9% | 0.9% | 0.2% | 3.0% | 9.6% |
| 16 | North Canaan | Town | 3,329 | 96.3% | 1.4% | 2.3% | 0.0% | 0.0% | 2.2% |
| 17 | Kent | Town | 2,982 | 98.5% | 0.3% | 0.8% | 0.7% | 0.0% | 0.3% |
| 18 | Goshen | Town | 2,957 | 99.1% | 0.1% | 0.7% | 0.4% | 0.2% | 5.5% |
| 19 | Sharon | Town | 2,804 | 92.0% | 0.4% | 1.4% | 0.3% | 6.8% | 8.5% |
| 20 | Morris | Town | 2,411 | 99.0% | 1.0% | 0.0% | 0.0% | 0.0% | 0.4% |
| 21 | Roxbury | Town | 2,315 | 99.0% | 0.0% | 0.3% | 1.3% | 0.3% | 5.3% |
| 22 | Bridgewater | Town | 1,790 | 96.6% | 1.7% | 1.3% | 0.3% | 1.9% | 6.2% |
| 23 | Norfolk | Town | 1,574 | 97.2% | 0.7% | 1.5% | 2.1% | 0.5% | 2.2% |
| 24 | Warren | Town | 1,531 | 98.5% | 0.0% | 0.9% | 0.3% | 1.0% | 3.0% |
| 25 | Cornwall | Town | 1,469 | 99.0% | 0.5% | 1.0% | 0.0% | 0.8% | 2.2% |
| 26 | Litchfield | Borough | 1,420 | 98.6% | 0.0% | 1.9% | 0.0% | 0.4% | 4.2% |
| 27 | Colebrook | Town | 1,395 | 99.4% | 0.5% | 0.0% | 0.8% | 0.0% | 0.6% |
| 28 | Canaan | Town | 1,183 | 97.5% | 1.6% | 0.2% | 0.2% | 1.0% | 2.8% |
| 29 | Bantam | Borough | 731 | 96.0% | 3.6% | 1.5% | 0.3% | 2.2% | 4.4% |
Politics
Litchfield County has voted for Republican presidential candidates more often than the rest of the state. In 2004 Bush won 51% to Kerry's 46%, making Litchfield the only county in southern New England that Bush carried. Litchfield was one of two Connecticut counties won by George H. W. Bush in 1992.[21] But in 2008, no county in Connecticut, including Litchfield, was won by Republican candidate John McCain. The county also went for the Democratic presidential candidate in 1964, 1996, and 2000. In 2012 it was the only county won by Mitt Romney in the state.[22] In 2016, Donald Trump overwhelmingly won the county.[23]
| Year | GOP | DEM | Others |
|---|---|---|---|
2016 | 54.4% 53,051 | 40.8% 39,775 | 4.7% 4,616 |
2012 | 51.1% 47,201 | 47.5% 43,856 | 1.5% 1,370 |
2008 | 46.7% 46,173 | 51.6% 51,041 | 1.8% 1,752 |
2004 | 51.9% 50,160 | 46.2% 44,647 | 1.9% 1,861 |
2000 | 44.9% 39,172 | 47.9% 41,806 | 7.3% 6,360 |
1996 | 38.9% 31,645 | 45.9% 37,375 | 15.2% 12,378 |
1992 | 37.0% 34,492 | 36.1% 33,686 | 26.9% 25,035 |
1988 | 56.0% 44,637 | 42.9% 34,227 | 1.1% 893 |
1984 | 66.2% 52,583 | 33.5% 26,564 | 0.3% 269 |
1980 | 50.7% 38,725 | 35.0% 26,705 | 14.3% 10,924 |
1976 | 55.3% 40,705 | 44.1% 32,419 | 0.6% 459 |
1972 | 60.2% 43,478 | 38.7% 27,929 | 1.1% 812 |
1968 | 48.8% 31,429 | 45.6% 29,340 | 5.6% 3,611 |
1964 | 34.1% 20,834 | 65.8% 40,172 | 0.1% 62 |
1960 | 53.9% 34,043 | 46.1% 29,062 | 0.0% 3 |
1956 | 69.9% 40,029 | 30.1% 17,226 | 0.0% 0 |
1952 | 63.8% 35,735 | 36.0% 20,163 | 0.2% 107 |
1948 | 58.0% 26,848 | 40.2% 18,628 | 1.8% 823 |
1944 | 55.2% 24,019 | 44.2% 19,212 | 0.6% 248 |
1940 | 54.0% 22,956 | 45.9% 19,537 | 0.1% 49 |
1936 | 50.7% 18,850 | 47.0% 17,468 | 2.4% 875 |
1932 | 56.9% 18,682 | 41.1% 13,469 | 2.0% 660 |
1928 | 63.7% 19,157 | 35.8% 10,766 | 0.5% 138 |
1924 | 61.4% 15,499 | 26.3% 6,645 | 12.4% 3,120 |
1920 | 65.9% 14,405 | 31.8% 6,938 | 2.3% 504 |
1916 | 53.0% 7,288 | 45.0% 6,183 | 2.0% 280 |
1912 | 42.0% 5,518 | 35.5% 4,661 | 22.5% 2,959 |
1908 | 66.2% 8,978 | 30.4% 4,128 | 3.4% 454 |
1904 | 64.6% 8,797 | 33.0% 4,500 | 2.4% 332 |
1900 | 64.1% 8,534 | 34.2% 4,554 | 1.6% 218 |
1896 | 61.3% 10,081 | 35.1% 5,771 | 3.6% 583 |
1892 | 47.2% 7,716 | 48.9% 7,998 | 3.9% 633 |
1888 | 48.6% 7,726 | 47.7% 7,582 | 3.8% 603 |
1884 | 50.8% 7,405 | 45.3% 6,601 | 3.9% 572 |
Transportation
Litchfield is served by the Northwestern Connecticut Transit District.[25][26]
Communities
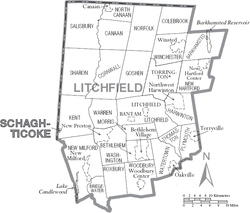
Map of Litchfield County, Connecticut showing cities, boroughs, towns, CDPs, and Indian Reservations

Map highlighting the Greater Torrington Micropolitan Area
Boroughs are incorporated portions of one or more towns with separate borough councils, zoning boards, and borough officials. Villages are named localities, but have no separate corporate existence from the towns they are in.
City
- Torrington
Towns
- Barkhamsted
- Bethlehem
- Bridgewater
- Canaan
- Colebrook
- Cornwall
- Goshen
Harwinton
- Northwest Harwinton
Kent
- South Kent
Litchfield
- Bantam
- Morris
- New Hartford
New Milford
- Gaylordsville
- Norfolk
- North Canaan
Plymouth
- Terryville
- Roxbury
Salisbury
- Lakeville
- Lime Rock
- Sharon
- Thomaston
- Warren
Washington
- New Preston
Watertown
- Oakville
Winchester
- Winsted
Woodbury
- Hotchkissville
Telephone area codes
All areas of the county are in area code 860 except for the towns of Woodbury, Bethlehem and a small part of Roxbury, which are in the area code 203/area code 475 overlay. The geographical Woodbury Telephone Exchange (of the now defunct Woodbury Telephone Company) serves the two towns as well as the town of Southbury, which is in New Haven County and the small part of Roxbury. Ten digit dialing took effect for both area codes on November 14, 2009 as a result of the 203/475 overlay and the planned but not implemented 860/959 overlay.
Attractions
- Abbey of Regina Laudis
- Appalachian Trail in Connecticut
Bash Bish Falls State Park - nearby in Massachusetts- Kent Falls State Park
- Litchfield Historic District
- Mohawk Mountain Ski Area
- West Cornwall Covered Bridge
See also
- Kent Hollow, Connecticut
- USS Litchfield County (LST-901)
- Litchfield Hills
Litchfield (disambiguation), for other places named "Litchfield"- National Register of Historic Places listings in Litchfield County, Connecticut
Torrington Titans Litchfield County's summer collegiate baseball team who play at Fuessenich Park in downtown Torrington.- Wildcat Hollow, Connecticut
References
^ ab "State & County QuickFacts". United States Census Bureau. Archived from the original on July 14, 2011. Retrieved June 11, 2014..mw-parser-output cite.citation{font-style:inherit}.mw-parser-output .citation q{quotes:"""""""'""'"}.mw-parser-output .citation .cs1-lock-free a{background:url("//upload.wikimedia.org/wikipedia/commons/thumb/6/65/Lock-green.svg/9px-Lock-green.svg.png")no-repeat;background-position:right .1em center}.mw-parser-output .citation .cs1-lock-limited a,.mw-parser-output .citation .cs1-lock-registration a{background:url("//upload.wikimedia.org/wikipedia/commons/thumb/d/d6/Lock-gray-alt-2.svg/9px-Lock-gray-alt-2.svg.png")no-repeat;background-position:right .1em center}.mw-parser-output .citation .cs1-lock-subscription a{background:url("//upload.wikimedia.org/wikipedia/commons/thumb/a/aa/Lock-red-alt-2.svg/9px-Lock-red-alt-2.svg.png")no-repeat;background-position:right .1em center}.mw-parser-output .cs1-subscription,.mw-parser-output .cs1-registration{color:#555}.mw-parser-output .cs1-subscription span,.mw-parser-output .cs1-registration span{border-bottom:1px dotted;cursor:help}.mw-parser-output .cs1-ws-icon a{background:url("//upload.wikimedia.org/wikipedia/commons/thumb/4/4c/Wikisource-logo.svg/12px-Wikisource-logo.svg.png")no-repeat;background-position:right .1em center}.mw-parser-output code.cs1-code{color:inherit;background:inherit;border:inherit;padding:inherit}.mw-parser-output .cs1-hidden-error{display:none;font-size:100%}.mw-parser-output .cs1-visible-error{font-size:100%}.mw-parser-output .cs1-maint{display:none;color:#33aa33;margin-left:0.3em}.mw-parser-output .cs1-subscription,.mw-parser-output .cs1-registration,.mw-parser-output .cs1-format{font-size:95%}.mw-parser-output .cs1-kern-left,.mw-parser-output .cs1-kern-wl-left{padding-left:0.2em}.mw-parser-output .cs1-kern-right,.mw-parser-output .cs1-kern-wl-right{padding-right:0.2em}
^ Gannett, Henry (1905). The Origin of Certain Place Names in the United States. U.S. Government Printing Office. p. 187.
^ "CCR: Volume 10, Page 56". Retrieved 2008-06-17.
[dead link]
^ Newberry Library -- Connecticut Atlas of Historical County Boundaries Archived 2013-11-10 at the Wayback Machine
^ 2d Connecticut Volunteer Heavy Artillery Regiment - Unit History. The2dconn.com. Retrieved on 2013-07-15.
^ "US Gazetteer files: 2010, 2000, and 1990". United States Census Bureau. 2011-02-12. Retrieved 2011-04-23.
^ "Population and Housing Unit Estimates". Retrieved Apr 8, 2018.
^ "U.S. Decennial Census". United States Census Bureau. Archived from the original on May 12, 2015. Retrieved June 11, 2014.
^ "Historical Census Browser". University of Virginia Library. Retrieved June 11, 2014.
^ "Population of Counties by Decennial Census: 1900 to 1990". United States Census Bureau. Retrieved June 11, 2014.
^ "Census 2000 PHC-T-4. Ranking Tables for Counties: 1990 and 2000" (PDF). United States Census Bureau. Retrieved June 11, 2014.
^ "American FactFinder". United States Census Bureau. Archived from the original on 2013-09-11. Retrieved 2011-05-14.
^ Bureau, U.S. Census. "American FactFinder - Community Facts". factfinder.census.gov.
^ abc "DP-1 Profile of General Population and Housing Characteristics: 2010 Demographic Profile Data". United States Census Bureau. Retrieved 2016-01-12.
^ "Population, Housing Units, Area, and Density: 2010 - County". United States Census Bureau. Retrieved 2016-01-12.
^ "DP02 SELECTED SOCIAL CHARACTERISTICS IN THE UNITED STATES – 2006-2010 American Community Survey 5-Year Estimates". United States Census Bureau. Retrieved 2016-01-12.
^ "DP03 SELECTED ECONOMIC CHARACTERISTICS – 2006-2010 American Community Survey 5-Year Estimates". United States Census Bureau. Retrieved 2016-01-12.
^ "SELECTED ECONOMIC CHARACTERISTICS 2006-2010 American Community Survey 5-Year Estimates". U.S. Census Bureau. Retrieved 2012-11-25.
^ "Profile of General Population and Housing Characteristics: 2010 Demographic Profile Data". U.S. Census Bureau. Archived from the original on 2014-03-05. Retrieved 2012-11-25.
^ "ACS DEMOGRAPHIC AND HOUSING ESTIMATES 2007-2011 American Community Survey 5-Year Estimates". U.S. Census Bureau. Retrieved 2013-01-08.
^ "David Leip's election Atlas". uselectionatlas.org.
^ "David Leip's election Atlas". uselectionatlas.org.
^ [1]
^ Leip, David. "Dave Leip's Atlas of U.S. Presidential Elections". uselectionatlas.org. Retrieved May 26, 2017.
^ "Home - Northwestern CT Transit District, Torrington CT". Northwestern CT Transit District, Torrington CT.
^ http://www.ct.gov/dot/lib/dot/documents/dpublications/gettingonboard_northwest.pdf
External links
| Wikimedia Commons has media related to Litchfield County, Connecticut. |
- Litchfield County Dispatch
- National Register of Historic Places listing for Litchfield Co., Connecticut
- The Gunn Museum
- Northwest Connecticut Arts Council
- Lake Waramaug Association
- Northwest Connecticut Convention and Visitors Bureau
Northwestern Connecticut Community College in Winsted
Places adjacent to Litchfield County, Connecticut | ||||||||||
|---|---|---|---|---|---|---|---|---|---|---|
| ||||||||||
Municipalities and communities of Litchfield County, Connecticut, United States | ||
|---|---|---|
County seat: Litchfield | ||
| Consolidated city |
|  |
| Towns |
| |
| Boroughs |
| |
| CDPs |
| |
| Other communities |
| |
| Indian reservation |
| |
Hartford (capital) | ||
| Topics |
|  |
| Society |
| |
| Regions |
| |
| Counties |
| |
| Cities |
| |
| All Towns |
| |
| Places |
| |
New York metropolitan area | ||
|---|---|---|
| Counties |
|  |
| Major cities |
| |
| Cities and towns over 100,000 |
| |
| Cities and towns over 25,000 |
| |
| Cities and towns over 10,000 |
| |
| Regions |
| |
Authority control |
|
|---|
Coordinates: 41°47′N 73°14′W / 41.79°N 73.24°W / 41.79; -73.24


