Cambridge (UK Parliament constituency)
Coordinates: 52°12′11″N 0°07′52″E / 52.203°N 0.131°E / 52.203; 0.131
| Cambridge | |
|---|---|
Borough constituency for the House of Commons | |
 Boundary of Cambridge in Cambridgeshire. | |
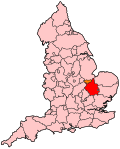 Location of Cambridgeshire within England. | |
| County | Cambridgeshire |
| Population | 114,740 (2011 census)[1] |
| Electorate | 75,259 (December 2010)[2] |
| Major settlements | Cambridge |
| Current constituency | |
| Created | 1295 |
| Member of parliament | Daniel Zeichner (Labour) |
| Number of members | 1295–1885: Two 1885–present: One |
| Overlaps | |
| European Parliament constituency | East of England |
Cambridge is a parliamentary constituency created in 1295 represented in the House of Commons of the U.K. Parliament.[n 1]
It has been represented since May 2015 by Daniel Zeichner, a member of the Labour Party.
.mw-parser-output .tocnumber{display:none}.mw-parser-output #toc ul,.mw-parser-output .toc ul{line-height:1.5em;list-style:none none;margin:.3em 0 0;padding:0}.mw-parser-output .hlist #toc ul ul,.mw-parser-output .hlist .toc ul ul{margin:0}
.mw-parser-output .horizontal-toc{}.mw-parser-output .horizontal-toc-align-left{float:right}.mw-parser-output .horizontal-toc-align-left{float:left}.mw-parser-output .horizontal-toc-align-center{margin-left:auto;margin-right:auto;clear:none}.mw-parser-output .horizontal-toc-clear-right{clear:right}.mw-parser-output .horizontal-toc-clear-left{clear:left}.mw-parser-output .horizontal-toc-clear-both{clear:both}.mw-parser-output .horizontal-toc-clear-none{clear:none}
Contents
1 History
1.1 Overview of results before 1992
1.2 Overview of results since 1992
2 Boundaries
3 Members of Parliament
3.1 MPs 1295–1660
3.2 MPs 1660–1885
3.3 MPs since 1885
4 Elections
4.1 Elections in the 2010s
4.2 Elections in the 2000s
4.3 Elections in the 1990s
4.4 Elections in the 1980s
4.5 Elections in the 1970s
4.6 Elections in the 1960s
4.7 Elections in the 1950s
4.8 Elections in the 1940s
4.9 Elections in the 1930s
4.10 Elections in the 1920s
4.11 Elections in the 1910s
4.12 Elections in the 1900s
4.13 Elections in the 1890s
4.14 Elections in the 1880s
4.15 Elections in the 1870s
4.16 Elections in the 1860s
4.17 Elections in the 1850s
4.18 Elections in the 1840s
4.19 Elections in the 1830s
4.20 Elections in the 1820s
4.21 Elections in the 1810s
4.22 Elections in the 1800s
4.23 Elections in the 1790s
4.24 Elections in the 1780s
4.25 Elections in the 1770s
4.26 Elections in the 1760s
4.27 Elections in the 1750s
4.28 Graphical representation
5 See also
6 Notes and references
7 External links
History
Overview of results before 1992
Before 1885 Cambridge elected two MPs using the bloc vote system. Under the Redistribution of Seats Act 1885 its representation was reduced to one member with effect from the 1885 general election. Cambridge returned two Members to Parliament regularly from 1295 onwards. These were generally townsmen who were involved in local government until many acquired government positions in the 18th century. The representation was reduced to one MP in 1885. Cambridge was Conservative-won from 1910 until 1934, from 1950 until 1966 and from 1967 until 1992. A Labour candidate first won Cambridge in 1945.
- Related extra representation 1603–1950
Historically the city of Cambridge retained some electors and was often the source of MPs to a second constituency, for Cambridge University, covering all successful alumni in its electorate. The university seat was created in 1603 as part of the scheme of University constituencies. Its MPs included Isaac Newton, William Pitt the Younger, Lord Palmerston, George Stokes, Richard Jebb, and Archibald Hill before abolition in 1950.
Overview of results since 1992
In 1992 Cambridge was won by Labour's Anne Campbell, who held onto the seat for 13 years (in this case three Parliamentary terms). In 2005 it was taken by David Howarth of the Liberal Democrats, the first time the party including its two forerunner parties had taken the seat since the 1906 Liberal-progressive landslide; his successor, Julian Huppert, held the seat with an increased majority in the 2010 general election. In 2015 Huppert was unseated by the Labour candidate Daniel Zeichner who took the seat with a thin majority of 599 votes. The 2015 result gave the seat the 7th-smallest majority of Labour's 232 seats by percentage of majority.[3]
- Most recent results of other parties
In 2015 three other parties candidates kept their deposits by winning more than 5% of the vote. In order of public preference these candidates stood for the Conservatives, Green Party and UKIP respectively.
- Turnout since 1918
Turnout at general elections has ranged between 86.48% in 1950 to 60.6% in 2001.
Boundaries

2010–present Cambridge wards and postcode districts map
1918-1983: The Borough of Cambridge.
1983-2010: The City of Cambridge wards of Abbey, Arbury, Castle, Cherry Hinton, Coleridge, East Chesterton, King's Hedges, Market, Newnham, Petersfield, Romsey, and West Chesterton.
2010-present: The City of Cambridge wards of Abbey, Arbury, Castle, Cherry Hinton, Coleridge, East Chesterton, King’s Hedges, Market, Newnham, Petersfield, Romsey, Trumpington, and West Chesterton.
The constituency roughly covers the city of Cambridge, including areas such as Chesterton, Newnham and Cherry Hinton, although one ward in the south of the city (Queen Edith's) is in South Cambridgeshire constituency; until 2010, this ward was joined in that seat by Trumpington ward. From 1983 to 1997, both wards were in the now-abolished seat of Cambridgeshire South West, and from 1997 to 2010 in Cambridgeshire South.
Members of Parliament
Constituency created (1295)
MPs 1295–1660
| Parliament | First member | Second member |
|---|---|---|
| 1386 | Robert Brigham | John Herries[4] |
| 1388 (Feb) | John Cotton | John Camp[4] |
| 1388 (Sep) | John Blankpayn | John Marshall[4] |
| 1390 (Jan) | Richard Maisterman | Robert Goodrich[4] |
| 1390 (Nov) | ||
| 1391 | John Camp | John Payn[4] |
| 1393 | John Herries | Robert Goodrich[4] |
| 1394 | Robert Brigham | Robert Goodrich[4] |
| 1395 | Robert Brigham | John Thriplow[4] |
| 1397 (Jan) | Hugh Candlesby | John Thriplow[4] |
| 1397 (Sep) | Thomas Trivet | Simon Bentbow[4] |
| 1399 | Hugh Candlesby | William Salle[4] |
| 1401 | ||
| 1402 | Robert Brigham | Thomas Trivet[4] |
| 1404 (Jan) | ||
| 1404 (Oct) | ||
| 1406 | John Knapton | John Bilney[4] |
| 1407 | Simon Bentbow | Thomas Beverley[4] |
| 1410 | ||
| 1411 | John Bush | John Alderhithe[4] |
| 1413 (Feb) | ||
| 1413 (May) | Stephen Neel | Robert Attilbridge[4] |
| 1414 (Apr) | John Beverley | John Warwick[4] |
| 1414 (Nov) | John Greenlane | John Hokington[4] |
| 1415 | John Knapton | Thomas Beverley[4] |
| 1416 (Mar) | John Bilney | John Sexton[4] |
| 1416 (Oct) | ||
| 1417 | John Bilney | Robert Attilbridge[4] |
| 1419 | John Knapton | Henry Topcliffe[4] |
| 1420 | John Cappe | Henry Topcliffe[4] |
| 1421 (May) | John Greenlane | John Bilney[4] |
| 1421 (Dec) | Richard Andrew | William Wedgwood[4] |
| 1447 | John Say | |
| 1510 | No nemes known[5] | |
| 1512 | John Bury | John Erlich[5] |
| 1515 | ? | |
| 1523 | ? | |
| 1529 | Thomas Brakyn | Robert Chapman[5] |
| 1536 | Thomas Brakyn | Robert Chapman[5] |
| 1539 | Thomas Brakyn | Robert Chapman[5] |
| 1542 | Thomas Brakyn | Edward Slegge[5] |
| 1545 | John Rust | Simon Trew[5] |
| 1547 | John Fanne, died and replaced Jan 1552 by John Rust | Richard Brakyn[5] |
| 1553 (Mar) | Robert Chapman | Alexander Ray[5] |
| 1553 (Oct) | James Fletcher | Richard Brakyn[5] |
| 1554 (Apr) | John Rust | Richard Brakyn[5] |
| 1554 (Nov) | Robert Chapman | Richard Brassney[5] |
| 1555 | Alexander Ray | Lawrence Hawes[5] |
| 1558 | John Line | Thomas Ventris[5] |
| 1558/1559 | Thomas Ventris | Roger Slegge[6] |
| 1562/1563 | Henry Serle | Roger Slegge[6] |
| 1571 (Mar) | Robert Shute | Roger Slegge[6] |
| 1572 (Apr) | Robert Shute, became a judge and replaced Jan 1581 by John North | Roger Slegge[6] |
| 1584 (Nov) | Henry North | Roger Slegge[6] |
| 1586 (Oct) | John Edmonds | Roger Slegge[6] |
| 1588 (Oct) | Nicholas Gaunte | Roger Slegge[6] |
| 1593 | Thomas Goldsborough | Christopher Hoddesdon[6] |
| 1597 (Oct) | Robert Wallis | John Yaxley[6] |
| 1601 (Oct) | Robert Wallis | John Yaxley[6] |
| 1604 | Robert Wallis | John Yaxley |
| 1614 | Sir Robert Hitcham | Francis Brakin |
| 1621 | Richard Foxton | Thomas Meautys |
| 1621 (Mar) | Sir John Hobart | |
| 1624 | Francis Brakyn | Robert Luckyn |
| 1625 | Talbot Pepys | Thomas Meautys |
| 1626 | Thomas Purchase | Thomas Meautys |
| 1628 | Thomas Purchase | Thomas Meautys |
| 1629–1640 | No Parliaments summoned | |
| 1640 (Apr) | Oliver Cromwell | Thomas Meautys |
| 1640 (Nov) | Oliver Cromwell | John Lowry |
| 1653 | Cambridge not represented in Barebone's Parliament | |
| 1654 | Richard Timbs | (one member only) |
| 1656 | Richard Timbs | (one member only) |
| 1659 | John Lowry | Richard Timbs |
MPs 1660–1885
| Election | 1st Member[7] | 1st Party | 2nd Member[7] | 2nd Party | ||
|---|---|---|---|---|---|---|
| 1660 | Sir Dudley North | Sir Thomas Wills, Bt | ||||
| 1661 | Sir William Compton | Roger Pepys | ||||
| 1664 | The Lord Alington | |||||
| 1679 | Sir Thomas Chicheley | |||||
| 1685 | Sir William Wren | |||||
| 1689 | Sir John Cotton, Bt | |||||
| 1690 | Granado Pigot | |||||
| 1695 | John Pepys | Isaac Watlington | ||||
| 1696 | Sir John Cotton, Bt | |||||
| 1698 | Sir Henry Pickering, Bt | |||||
| 1702 | Anthony Thompson | |||||
| 1705 | Sir John Cotton, Bt | |||||
1708 | Sir John Hynde Cotton, Bt | Tory | Samuel Shepheard | |||
January 1715 | Thomas Sclater | Tory | ||||
| May 1715 | Samuel Shepheard | |||||
January 1722 | Thomas Bacon | Tory | ||||
| October 1722 | Gilbert Affleck | |||||
1727 | Sir John Hynde Cotton, Bt | |||||
| 1737 | Gilbert Affleck | |||||
1741 | Viscount Dupplin | Whig | James Martin | |||
| 1744 | Christopher Jeaffreson | |||||
1747 | Samuel Shepheard | |||||
| 1748 | Christopher Jeaffreson | |||||
| 1749 | Charles Cadogan | Tory[8] | ||||
1754 | Hon. Thomas Bromley | Whig | ||||
| 1755 | Charles Cadogan | Tory[8] | ||||
| 1758 | Soame Jenyns | Tory[8] | ||||
| 1776 | Benjamin Keene | Tory[8] | ||||
| 1780 | James Whorwood Adeane | Tory[8] | ||||
1784 | John Mortlock | Whig[8] | ||||
| 1788 | Francis Dickins | Tory[8] | ||||
| 1789 | Edward Finch | Tory[8] | ||||
| 1791 | Robert Manners | Tory[8] | ||||
| 1819 | Frederick Trench | Tory[8] | ||||
1820 | Charles Madryll Cheere | Tory[8] | ||||
| 1825 | Marquess of Graham | Tory[8] | ||||
1832 | George Pryme | Whig[8][9] | Thomas Spring Rice | Whig[8] | ||
1839 | John Manners-Sutton | Conservative[8] | ||||
1840 | Sir Alexander Grant, Bt | Conservative[8] | ||||
1841 | Hon. John Manners-Sutton | Conservative[8] | ||||
1843 | Fitzroy Kelly | Conservative[8] | ||||
1847 | Robert Adair | Whig[10][11][12][13][14] | Hon. William Campbell | Whig[13][14] | ||
1852 | Kenneth Macaulay | Conservative | John Harvey Astell | Conservative | ||
| March 1853 | Writ suspended[15] | |||||
1854 | Robert Adair | Radical[16][17][18] | Francis Mowatt | Radical[19][20] | ||
1857 | Kenneth Macaulay | Conservative | Andrew Steuart | Conservative | ||
1863 | Francis Powell | Conservative | ||||
1865 | William Forsyth | Conservative | ||||
1866 | John Eldon Gorst | Conservative | ||||
1868 | Robert Torrens | Liberal | William Fowler | Liberal | ||
1874 | Alfred Marten | Conservative | Patrick Boyle Smollett | Conservative | ||
1880 | William Fowler | Liberal | Hugh Shield | Liberal | ||
1885 | representation reduced to one member | |||||
MPs since 1885
| Election | Member[21][7] | Party | |
|---|---|---|---|
1885 | Robert Uniacke-Penrose-Fitzgerald | Conservative | |
1906 | Stanley Buckmaster | Liberal | |
Jan 1910 | Almeric Paget | Conservative | |
1917 by-election | Sir Eric Geddes | Coalition Conservative | |
1922 by-election | Sir George Newton | Conservative | |
1934 by-election | Richard Tufnell | Conservative | |
1945 | Arthur Symonds | Labour | |
1950 | Sir Hamilton Kerr, Bt. | Conservative | |
1966 | Robert Davies | Labour | |
1967 by-election | David Lane | Conservative | |
1976 by-election | Robert Rhodes James | Conservative | |
1992 | Anne Campbell | Labour | |
2005 | David Howarth | Liberal Democrat | |
2010 | Julian Huppert | Liberal Democrat | |
2015 | Daniel Zeichner | Labour | |
Elections
Elections in the 2010s
2010s – 2000s – 1990s – 1980s – 1970s – 1960s – 1950s – 1940s – 1930s – 1920s – 1910s – 1900s – 1890s – 1880s – 1870s – 1860s– 1850s– 1840s– 1830s– 1820s– 1810s– 1800s– 1790s– 1780s– 1770s– 1760s– 1750s– Back to Top |
| Party | Candidate | Votes | % | ± | |
|---|---|---|---|---|---|
Liberal Democrat | Rod Cantrill[22] | ||||
| Party | Candidate | Votes | % | ± | |
|---|---|---|---|---|---|
Labour | Daniel Zeichner | 29,032 | 51.9 | +15.9 | |
Liberal Democrat | Julian Huppert | 16,371 | 29.3 | -5.6 | |
Conservative | John Hayward | 9,133 | 16.3 | +0.7 | |
Green | Stuart Tuckwood | 1,265 | 2.2 | −5.7 | |
| Rebooting Democracy | Keith Garrett | 133 | 0.2 | −0.1 | |
| Majority | 12,661 | 22.6 | +21.4 | ||
Turnout | 55,934 | 71.7 | + 9.6 | ||
Labour hold | Swing | +10.7 | |||
| Party | Candidate | Votes | % | ± | |
|---|---|---|---|---|---|
Labour | Daniel Zeichner | 18,646 | 36.0 | +11.7 | |
Liberal Democrat | Julian Huppert | 18,047 | 34.9 | −4.3 | |
Conservative | Chamali Fernando | 8,117 | 15.7 | −9.9 | |
Green | Rupert Read | 4,109 | 7.9 | +0.3 | |
UKIP | Patrick O'Flynn | 2,668 | 5.2 | +2.8 | |
| Rebooting Democracy | Keith Garrett | 187 | 0.4 | N/A | |
| Majority | 599 | 1.2 | |||
Turnout | 51,774 | 62.1 | −2.9 | ||
Labour gain from Liberal Democrat | Swing | +8.0 | |||
| Party | Candidate | Votes | % | ± | |
|---|---|---|---|---|---|
Liberal Democrat | Julian Huppert | 19,621 | 39.1 | −5.6 | |
Conservative | Nick Hillman | 12,829 | 25.6 | +8.3 | |
Labour | Daniel Zeichner | 12,174 | 24.3 | −9.7 | |
Green | Tony Juniper | 3,804 | 7.6 | +4.7 | |
UKIP | Peter Burkinshaw | 1,195 | 2.4 | +1.0 | |
| Cambridge Socialists | Martin Booth | 362 | 0.7 | N/A | |
Independent | Old Holborn (Robert Ambridge)[n 2] | 145 | 0.3 | N/A | |
| Majority | 6,792 | 13.5 | |||
Turnout | 50,130 | 65.0 | +6.1 | ||
Liberal Democrat hold | Swing | −7.0 | |||
Elections in the 2000s
2010s – 2000s – 1990s – 1980s – 1970s – 1960s – 1950s – 1940s – 1930s – 1920s – 1910s – 1900s – 1890s – 1880s – 1870s – 1860s– 1850s– 1840s– 1830s– 1820s– 1810s– 1800s– 1790s– 1780s– 1770s– 1760s– 1750s– Back to Top |
| Party | Candidate | Votes | % | ± | |
|---|---|---|---|---|---|
Liberal Democrat | David Howarth | 19,152 | 44.0 | +18.9 | |
Labour | Anne Campbell | 14,813 | 34.0 | −11.1 | |
Conservative | Ian Lyon | 7,193 | 16.5 | −6.4 | |
Green | Martin Lucas-Smith | 1,245 | 2.9 | −0.4 | |
UKIP | Helene Davies | 569 | 1.3 | +0.1 | |
Respect | Tom Woodcock | 477 | 1.1 | N/A | |
Independent | Suzon Forscey-Moore | 60 | 0.1 | N/A | |
Independent | Graham Wilkinson | 60 | 0.1 | N/A | |
| Majority | 4,339 | 10.0 | |||
Turnout | 43,569 | 62.1 | +1.5 | ||
Liberal Democrat gain from Labour | Swing | +15.0 | |||
| Party | Candidate | Votes | % | ± | |
|---|---|---|---|---|---|
Labour | Anne Campbell | 19,316 | 45.1 | −8.3 | |
Liberal Democrat | David Howarth | 10,737 | 25.1 | +8.9 | |
Conservative | Graham Stuart | 9,829 | 22.9 | −3.0 | |
Green | Stephen Lawrence | 1,413 | 3.3 | +2.0 | |
Socialist Alliance | Howard Senter | 716 | 1.7 | N/A | |
UKIP | Len Baynes | 532 | 1.2 | N/A | |
ProLife Alliance | Clare Underwood | 232 | 0.5 | +0.2 | |
Workers Revolutionary | Margaret Courtney | 61 | 0.1 | −0.1 | |
| Majority | 8,579 | 20.0 | −7.5 | ||
Turnout | 42,836 | 60.6 | −10.9 | ||
Labour hold | Swing | −8.6 | |||
Elections in the 1990s
2010s – 2000s – 1990s – 1980s – 1970s – 1960s – 1950s – 1940s – 1930s – 1920s – 1910s – 1900s – 1890s – 1880s – 1870s – 1860s– 1850s– 1840s– 1830s– 1820s– 1810s– 1800s– 1790s– 1780s– 1770s– 1760s– 1750s– Back to Top |
| Party | Candidate | Votes | % | ± | |
|---|---|---|---|---|---|
Labour | Anne Campbell | 27,436 | 53.4 | +13.7 | |
Conservative | David Platt | 13,299 | 25.9 | -12.6 | |
Liberal Democrat | Geoffrey Heathcock | 8,287 | 16.1 | -3.8 | |
Referendum | William Burrows | 1,262 | 2.5 | N/A | |
Green | Margaret Wright | 654 | 1.3 | -0.1 | |
ProLife Alliance | Anna Johnstone | 191 | 0.4 | N/A | |
Workers Revolutionary | Raymond Athow | 107 | 0.2 | N/A | |
Natural Law | M. Gladwin | 103 | 0.2 | N/A | |
| Majority | 14,137 | 27.5 | +26.3 | ||
Turnout | 51,339 | 71.5 | |||
Labour hold | Swing | ||||
| Party | Candidate | Votes | % | ± | |
|---|---|---|---|---|---|
Labour | Anne Campbell | 20,039 | 39.7 | +11.4 | |
Conservative | Mark Bishop | 19,459 | 38.5 | −1.5 | |
Liberal Democrat | David Howarth | 10,037 | 19.9 | −10.7 | |
Green | Tim Cooper | 720 | 1.4 | +0.3 | |
Monster Raving Loony | Richard Brettell-Winnington | 175 | 0.3 | N/A | |
Natural Law | Roger Chalmers | 83 | 0.2 | N/A | |
| Majority | 580 | 1.2 | |||
Turnout | 50,513 | 73.2 | |||
Labour gain from Conservative | Swing | ||||
Elections in the 1980s
2010s – 2000s – 1990s – 1980s – 1970s – 1960s – 1950s – 1940s – 1930s – 1920s – 1910s – 1900s – 1890s – 1880s – 1870s – 1860s– 1850s– 1840s– 1830s– 1820s– 1810s– 1800s– 1790s– 1780s– 1770s– 1760s– 1750s– Back to Top |
| Party | Candidate | Votes | % | ± | |
|---|---|---|---|---|---|
Conservative | Robert Rhodes James | 21,624 | 40.0 | −1.5 | |
Social Democratic | Shirley Williams | 16,564 | 30.6 | +0.9 | |
Labour | Christopher Howard | 15,319 | 28.3 | +0.1 | |
Green | Margaret Wright | 597 | 1.1 | N/A | |
| Majority | 5,060 | 9.35 | |||
Turnout | 54,104 | 78.03 | |||
Conservative hold | Swing | ||||
| Party | Candidate | Votes | % | ± | |
|---|---|---|---|---|---|
Conservative | Robert Rhodes James | 20,931 | 41.5 | -1.48 | |
Social Democratic | Matthew Oakeshott | 14,963 | 29.7 | +12.62 | |
Labour | Janet Jones | 14,240 | 28.24 | -11.15 | |
Monster Raving Loony | John Dougrez-Lewis | 286 | 0.57 | N/A | |
| Majority | 5,968 | 11.84 | |||
Turnout | 50,420 | 75.23 | |||
Conservative hold | Swing | ||||
Elections in the 1970s
2010s – 2000s – 1990s – 1980s – 1970s – 1960s – 1950s – 1940s – 1930s – 1920s – 1910s – 1900s – 1890s – 1880s – 1870s – 1860s– 1850s– 1840s– 1830s– 1820s– 1810s– 1800s– 1790s– 1780s– 1770s– 1760s– 1750s– Back to Top |
| Party | Candidate | Votes | % | ± | |
|---|---|---|---|---|---|
Conservative | Robert Rhodes James | 25,568 | 45.71 | +4.46 | |
Labour | Martin Howard Smith | 20,772 | 37.14 | +1.13 | |
Liberal | John Derek Wakelin | 9,285 | 16.60 | -4.47 | |
National Front | Derek William Holland | 311 | 0.56 | N/A | |
| Majority | 4,796 | 8.57 | |||
Turnout | 55,936 | 72.02 | |||
Conservative hold | Swing | +1.66 | |||
| Party | Candidate | Votes | % | ± | |
|---|---|---|---|---|---|
Conservative | Robert Rhodes James | 19,620 | 51.03 | +9.78 | |
Labour | Martin Smith | 9,995 | 25.99 | -10.01 | |
Liberal | Michael O'Loughlin | 7,051 | 18.34 | -2.73 | |
Independent | James Sharpe | 711 | 1.85 | N/A | |
National Front | Jeremy Wotherspoon | 700 | 1.82 | N/A | |
| Science Fiction Looney | Philip Sargent | 374 | 0.97 | N/A | |
| Majority | 9,625 | 25.03 | +19.78 | ||
Conservative hold | Swing | ||||
| Party | Candidate | Votes | % | ± | |
|---|---|---|---|---|---|
Conservative | David Lane | 21,790 | 41.25 | +0.66 | |
Labour | James Patrick Curran | 19,017 | 36.00 | +3.28 | |
Liberal | Michael Wilfrid Bryan O'Loughlin | 11,129 | 21.07 | -5.00 | |
United Democratic Party | Christopher John Curry | 885 | 1.68 | N/A | |
| Majority | 2,773 | 5.25 | |||
Turnout | 52,821 | 69.56 | |||
Conservative hold | Swing | -1.31 | |||
| Party | Candidate | Votes | % | ± | |
|---|---|---|---|---|---|
Conservative | David Lane | 24,119 | 40.59 | ||
Labour | James Patrick Curran | 19,443 | 32.72 | ||
Liberal | Michael Wilfrid Bryan O'Loughlin | 15,491 | 26.07 | ||
Independent | Susan Elisabeth Inkster | 369 | 0.62 | N/A | |
| Majority | 4,676 | 7.87 | |||
Turnout | 59,422 | 78.74 | |||
Conservative hold | Swing | ||||
| Party | Candidate | Votes | % | ± | |
|---|---|---|---|---|---|
Conservative | David Lane | 26,252 | 55.33 | +11.91 | |
Labour | George Scurfield | 21,191 | 44.67 | -0.80 | |
| Majority | 5,061 | 10.67 | N/A | ||
Turnout | 47,443 | 72.37 | -7.63 | ||
Registered electors | 65,554 | ||||
Conservative gain from Labour | Swing | +6.36 | |||
Elections in the 1960s
2010s – 2000s – 1990s – 1980s – 1970s – 1960s – 1950s – 1940s – 1930s – 1920s – 1910s – 1900s – 1890s – 1880s – 1870s – 1860s– 1850s– 1840s– 1830s– 1820s– 1810s– 1800s– 1790s– 1780s– 1770s– 1760s– 1750s– Back to Top |
| Party | Candidate | Votes | % | ± | |
|---|---|---|---|---|---|
Conservative | David Lane | 20,488 | 51.61 | +8.19 | |
Labour | George Scurfield | 14,510 | 36.55 | -8.92 | |
Liberal | David Spreckley | 4,701 | 11.84 | +1.64 | |
| Majority | 5,978 | 15.06 | |||
Turnout | 39,699 | 65.7 | |||
Conservative gain from Labour | Swing | ||||
| Party | Candidate | Votes | % | ± | |
|---|---|---|---|---|---|
Labour | Robert Davies | 21,963 | 45.47 | +5.01 | |
Conservative | David Lane | 20,972 | 43.42 | +0.05 | |
Liberal | Michael WB O'Loughlin | 4,928 | 10.20 | -5.97 | |
Independent | Peter King | 439 | 0.91 | N/A | |
| Majority | 991 | 2.05 | N/A | ||
Turnout | 48,302 | 80.00 | +0.86 | ||
Registered electors | 60,380 | ||||
Labour gain from Conservative | Swing | +2.48 | |||
| Party | Candidate | Votes | % | ± | |
|---|---|---|---|---|---|
Conservative | Hamilton Kerr | 20,720 | 43.37 | -7.69 | |
Labour | Robert Davies | 19,331 | 40.46 | +3.67 | |
Liberal | Michael WB O'Loughlin | 7,723 | 16.17 | +4.02 | |
| Majority | 1,389 | 2.91 | -11.36 | ||
Turnout | 47,774 | 79.14 | -0.67 | ||
Registered electors | 60,365 | ||||
Conservative hold | Swing | -5.68 | |||
Elections in the 1950s
2010s – 2000s – 1990s – 1980s – 1970s – 1960s – 1950s – 1940s – 1930s – 1920s – 1910s – 1900s – 1890s – 1880s – 1870s – 1860s– 1850s– 1840s– 1830s– 1820s– 1810s– 1800s– 1790s– 1780s– 1770s– 1760s– 1750s– Back to Top |
| Party | Candidate | Votes | % | ± | |
|---|---|---|---|---|---|
Conservative | Hamilton Kerr | 24,350 | 51.06 | -6.50 | |
Labour | Robert Davies | 17,543 | 36.79 | -5.65 | |
Liberal | Arnold Geoffroy de Montmorency | 5,792 | 12.15 | -10.29 | |
| Majority | 6,807 | 14.27 | -0.85 | ||
Turnout | 59,745 | 79.81 | +1.28 | ||
Registered electors | 59,745 | ||||
Conservative hold | Swing | -0.43 | |||
| Party | Candidate | Votes | % | ± | |
|---|---|---|---|---|---|
Conservative | Hamilton Kerr | 27,059 | 57.56 | +5.17 | |
Labour | Arthur Symonds | 19,953 | 42.44 | +1.25 | |
| Majority | 7,106 | 15.12 | +3.93 | ||
Turnout | 47,012 | 78.53 | -5.91 | ||
Registered electors | 59,868 | ||||
Conservative hold | Swing | +1.96 | |||
| Party | Candidate | Votes | % | ± | |
|---|---|---|---|---|---|
Conservative | Hamilton Kerr | 26,570 | 52.39 | +2.88 | |
Labour | Arthur Symonds | 20,893 | 41.19 | +1.24 | |
Liberal | Francis L Josephy | 3,257 | 6.42 | -4.12 | |
| Majority | 5,677 | 11.19 | +1.64 | ||
Turnout | 50,720 | 84.44 | -2.04 | ||
Registered electors | 60,064 | ||||
Conservative hold | Swing | +0.82 | |||
| Party | Candidate | Votes | % | ± | |
|---|---|---|---|---|---|
Conservative | Hamilton Kerr | 25,151 | 49.51 | +0.39 | |
Labour | Arthur Symonds | 20,297 | 39.95 | -10.93 | |
Liberal | Francis L Josephy | 5,355 | 10.54 | N/A | |
| Majority | 4,854 | 9.55 | N/A | ||
Turnout | 50,803 | 86.48 | +17.32 | ||
Registered electors | 58,742 | ||||
Conservative gain from Labour | Swing | +5.66 | |||
Elections in the 1940s
2010s – 2000s – 1990s – 1980s – 1970s – 1960s – 1950s – 1940s – 1930s – 1920s – 1910s – 1900s – 1890s – 1880s – 1870s – 1860s– 1850s– 1840s– 1830s– 1820s– 1810s– 1800s– 1790s– 1780s– 1770s– 1760s– 1750s– Back to Top |
| Party | Candidate | Votes | % | ± | |
|---|---|---|---|---|---|
Labour | Arthur Symonds | 19,671 | 50.88 | +9.36 | |
Conservative | Richard Tufnell | 18,989 | 49.12 | -9.36 | |
| Majority | 682 | 1.76 | N/A | ||
Turnout | 38,600 | 69.16 | -4.06 | ||
Registered electors | 55,898 | ||||
Labour gain from Conservative | Swing | +9.36 | |||
Elections in the 1930s
2010s – 2000s – 1990s – 1980s – 1970s – 1960s – 1950s – 1940s – 1930s – 1920s – 1910s – 1900s – 1890s – 1880s – 1870s – 1860s– 1850s– 1840s– 1830s– 1820s– 1810s– 1800s– 1790s– 1780s– 1770s– 1760s– 1750s– Back to Top |
| Party | Candidate | Votes | % | ± | |
|---|---|---|---|---|---|
Conservative | Richard Tufnell | 18,927 | 58.48 | -14.71 | |
Labour | Dr Alexander Wood | 13,436 | 41.52 | +14.71 | |
| Majority | 5,491 | 16.97 | -29.41 | ||
Turnout | 32,363 | 73.22 | -2.40 | ||
Registered electors | 44,197 | ||||
Conservative hold | Swing | -14.71 | |||
| Party | Candidate | Votes | % | ± | |
|---|---|---|---|---|---|
Conservative | George Newton | 23,347 | 73.19 | +30.00 | |
Labour | Dr Alexander Wood | 8,552 | 26.81 | -4.70 | |
| Majority | 14,795 | 46.38 | +34.70 | ||
Turnout | 31,899 | 75.62 | -4.19 | ||
Registered electors | 42,186 | ||||
Conservative hold | Swing | +17.35 | |||
Elections in the 1920s
2010s – 2000s – 1990s – 1980s – 1970s – 1960s – 1950s – 1940s – 1930s – 1920s – 1910s – 1900s – 1890s – 1880s – 1870s – 1860s– 1850s– 1840s– 1830s– 1820s– 1810s– 1800s– 1790s– 1780s– 1770s– 1760s– 1750s– Back to Top |
| Party | Candidate | Votes | % | ± | |
|---|---|---|---|---|---|
Conservative | George Newton | 13,867 | 43.19 | -9.33 | |
Labour | David Hardman | 10,116 | 31.51 | +12.09 | |
Liberal | Maurice Amos | 8,124 | 25.30 | -2.75 | |
| Majority | 3,751 | 11.68 | -2.20 | ||
Turnout | 32,107 | 79.81 | -2.04 | ||
Registered electors | 40,227 | ||||
Conservative hold | Swing | -4.87 | |||
| Party | Candidate | Votes | % | ± | |
|---|---|---|---|---|---|
Conservative | George Newton | 12,628 | 52.52 | +10.59 | |
Liberal | Alec Sandy Firth | 6,744 | 28.05 | -5.50 | |
Labour | Frank Reyner Salter | 4,670 | 19.42 | -5.11 | |
| Majority | 5,884 | 13.88 | +5.50 | ||
Turnout | 24,042 | 81.85 | +0.91 | ||
Registered electors | 29,372 | ||||
Conservative hold | Swing | +8.05 | |||
| Party | Candidate | Votes | % | ± | |
|---|---|---|---|---|---|
Conservative | George Newton | 9,814 | 41.93 | -6.82 | |
Liberal | Sydney Cope Morgan | 7,852 | 33.55 | +3.16 | |
Labour | Alec Sandy Firth | 5,741 | 24.53 | +3.67 | |
| Majority | 1,962 | 8.38 | -9.98 | ||
Turnout | 23,407 | 80.94 | -0.23 | ||
Registered electors | 28,920 | ||||
Conservative hold | Swing | -4.99 | |||
| Party | Candidate | Votes | % | ± | |
|---|---|---|---|---|---|
Conservative | George Newton | 11,238 | 48.75 | -26.65 | |
Liberal | Sydney Cope Morgan | 7,005 | 30.39 | +5.69 | |
Labour | Alec Sandy Firth | 4,810 | 20.86 | N/A | |
| Majority | 4,233 | 18.36 | -32.24 | ||
Turnout | 23,053 | 81.17 | +20.22 | ||
Registered electors | 28,402 | ||||
Conservative hold | Swing | -16.17 | |||
| Party | Candidate | Votes | % | ± | |
|---|---|---|---|---|---|
Conservative | George Newton | 10,897 | 48.69 | -26.61 | |
Labour | Hugh Dalton | 6,954 | 31.07 | N/A | |
Liberal | Sydney Cope Morgan | 4,529 | 20.24 | -4.46 | |
| Majority | 3,943 | 17.62 | -32.98 | ||
Turnout | 22,380 | 80.41 | +19.46 | ||
Registered electors | 27,833 | ||||
Conservative hold | Swing | -28.84 | |||
Elections in the 1910s
2010s – 2000s – 1990s – 1980s – 1970s – 1960s – 1950s – 1940s – 1930s – 1920s – 1910s – 1900s – 1890s – 1880s – 1870s – 1860s– 1850s– 1840s– 1830s– 1820s– 1810s– 1800s– 1790s– 1780s– 1770s– 1760s– 1750s– Back to Top |
| Party | Candidate | Votes | % | ± | |
|---|---|---|---|---|---|
C | Unionist | Eric Campbell Geddes | 11,553 | 75.30 | N/A |
Labour | Thomas Rhondda Williams | 3,789 | 24.70 | N/A | |
| Majority | 7,764 | 50.60 | N/A | ||
Turnout | 15,342 | 60.95 | N/A | ||
Registered electors | 25,170 | ||||
Unionist hold | Swing | N/A | |||
C indicates candidate endorsed by the coalition government. | |||||
| Party | Candidate | Votes | % | ± | |
|---|---|---|---|---|---|
Unionist | Eric Campbell Geddes | Unopposed | |||
Unionist hold | |||||
| Party | Candidate | Votes | % | ± | |
|---|---|---|---|---|---|
Conservative | Almeric Paget | 4,427 | 5.20 | -1.4 | |
Liberal | Stanley Buckmaster | 4,084 | 48.0 | +1.4 | |
| Majority | 343 | 4.0 | -2.8 | ||
Turnout | 8,511 | 90.6 | -2.6 | ||
Registered electors | 9,392 | ||||
Conservative hold | Swing | -1.4 | |||
| Party | Candidate | Votes | % | ± | |
|---|---|---|---|---|---|
Conservative | Almeric Paget | 4,667 | 53.4 | +5.3 | |
Liberal | Stanley Buckmaster | 4,080 | 46.6 | -5.3 | |
| Majority | 587 | 6.8 | N/A | ||
Turnout | 8,747 | 93.1 | +0.9 | ||
Registered electors | 9,392 | ||||
Conservative gain from Liberal | Swing | +5.3 | |||
Elections in the 1900s
2010s – 2000s – 1990s – 1980s – 1970s – 1960s – 1950s – 1940s – 1930s – 1920s – 1910s – 1900s – 1890s – 1880s – 1870s – 1860s– 1850s– 1840s– 1830s– 1820s– 1810s– 1800s– 1790s– 1780s– 1770s– 1760s– 1750s– Back to Top |
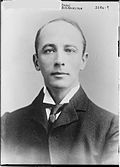
Buckmaster
| Party | Candidate | Votes | % | ± | |
|---|---|---|---|---|---|
Liberal | Stanley Buckmaster | 4,232 | 51.9 | N/A | |
Conservative | Almeric Paget | 3,924 | 48.1 | N/A | |
| Majority | 308 | 3.8 | N/A | ||
Turnout | 8,156 | 92.2 | N/A | ||
Registered electors | 8,850 | ||||
Liberal gain from Conservative | Swing | N/A | |||
| Party | Candidate | Votes | % | ± | |
|---|---|---|---|---|---|
Conservative | Robert Uniacke-Penrose-Fitzgerald | Unopposed | |||
Conservative hold | |||||
Elections in the 1890s
2010s – 2000s – 1990s – 1980s – 1970s – 1960s – 1950s – 1940s – 1930s – 1920s – 1910s – 1900s – 1890s – 1880s – 1870s – 1860s– 1850s– 1840s– 1830s– 1820s– 1810s– 1800s– 1790s– 1780s– 1770s– 1760s– 1750s– Back to Top |
| Party | Candidate | Votes | % | ± | |
|---|---|---|---|---|---|
Conservative | Robert Uniacke-Penrose-Fitzgerald | 3,574 | 55.0 | +3.0 | |
Liberal | AJ David | 2,920 | 45.0 | -3.0 | |
| Majority | 654 | 10.0 | +6.0 | ||
Turnout | 6,494 | 83.3 | -2.9 | ||
Registered electors | 7,796 | ||||
Conservative hold | Swing | +3.0 | |||
| Party | Candidate | Votes | % | ± | |
|---|---|---|---|---|---|
Conservative | Robert Uniacke-Penrose-Fitzgerald | 3,299 | 52.0 | -2.2 | |
Liberal | R. C. Lehmann | 3,044 | 48.0 | +2.2 | |
| Majority | 255 | 4.0 | -4.4 | ||
Turnout | 6,343 | 86.2 | -1.3 | ||
Registered electors | 7,362 | ||||
Conservative hold | Swing | -2.2 | |||
Elections in the 1880s
2010s – 2000s – 1990s – 1980s – 1970s – 1960s – 1950s – 1940s – 1930s – 1920s – 1910s – 1900s – 1890s – 1880s – 1870s – 1860s– 1850s– 1840s– 1830s– 1820s– 1810s– 1800s– 1790s– 1780s– 1770s– 1760s– 1750s– Back to Top |
| Party | Candidate | Votes | % | ± | |
|---|---|---|---|---|---|
Conservative | Robert Uniacke-Penrose-Fitzgerald | 2,937 | 54.2 | +3.2 | |
Liberal | Cyril Dodd[56] | 2,479 | 45.8 | -3.2 | |
| Majority | 458 | 8.4 | +6.4 | ||
Turnout | 5,416 | 87.5 | -2.7 | ||
Registered electors | 6,189 | ||||
Conservative hold | Swing | +3.2 | |||
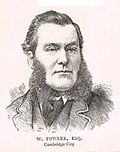
Fowler
| Party | Candidate | Votes | % | ± | |
|---|---|---|---|---|---|
Conservative | Robert Uniacke-Penrose-Fitzgerald | 2,846 | 51.0 | +5.7 | |
Liberal | William Fowler | 2,739 | 49.0 | −5.7 | |
| Majority | 107 | 2.0 | N/A | ||
Turnout | 5,585 | 90.2 | +0.6 (est) | ||
Registered electors | 6,189 | ||||
Conservative win | |||||
| Party | Candidate | Votes | % | ± | |
|---|---|---|---|---|---|
Liberal | William Fowler | 2,386 | 27.7 | +2.9 | |
Liberal | Hugh Shield | 2,326 | 27.0 | +2.7 | |
Conservative | Alfred Marten | 2,003 | 23.2 | −2.7 | |
Conservative | Patrick Boyle Smollett | 1,902 | 22.1 | −2.9 | |
| Majority | 323 | 3.7 | N/A | ||
Turnout | 4,309 (est) | 89.6 (est) | +8.7 | ||
Registered electors | 4,806 | ||||
Liberal gain from Conservative | Swing | +2.8 | |||
Liberal gain from Conservative | Swing | +2.8 | |||
Elections in the 1870s
2010s – 2000s – 1990s – 1980s – 1970s – 1960s – 1950s – 1940s – 1930s – 1920s – 1910s – 1900s – 1890s – 1880s – 1870s – 1860s– 1850s– 1840s– 1830s– 1820s– 1810s– 1800s– 1790s– 1780s– 1770s– 1760s– 1750s– Back to Top |
| Party | Candidate | Votes | % | ± | |
|---|---|---|---|---|---|
Conservative | Alfred Marten | 1,856 | 25.9 | +4.0 | |
Conservative | Patrick Boyle Smollett | 1,794 | 25.0 | +3.8 | |
Liberal | William Fowler | 1,774 | 24.8 | −3.5 | |
Liberal | Robert Torrens | 1,738 | 24.3 | −4.3 | |
| Majority | 20 | 0.3 | N/A | ||
Turnout | 3,581 (est) | 80.9 (est) | −1.1 | ||
Registered electors | 4,428 | ||||
Conservative gain from Liberal | Swing | +4.0 | |||
Conservative gain from Liberal | Swing | +3.9 | |||
Elections in the 1860s
2010s – 2000s – 1990s – 1980s – 1970s – 1960s – 1950s – 1940s – 1930s – 1920s – 1910s – 1900s – 1890s – 1880s – 1870s – 1860s– 1850s– 1840s– 1830s– 1820s– 1810s– 1800s– 1790s– 1780s– 1770s– 1760s– 1750s– Back to Top |
| Party | Candidate | Votes | % | ± | |
|---|---|---|---|---|---|
Liberal | Robert Torrens | 1,879 | 28.6 | +4.2 | |
Liberal | William Fowler | 1,857 | 28.3 | +3.9 | |
Conservative | Francis Powell | 1,436 | 21.9 | −3.7 | |
Conservative | John Eldon Gorst | 1,389 | 21.2 | −4.4 | |
| Majority | 421 | 6.4 | N/A | ||
Turnout | 3,281 (est) | 82.0 (est) | −2.0 | ||
Registered electors | 4,000 | ||||
Liberal gain from Conservative | Swing | +4.0 | |||
Liberal gain from Conservative | Swing | +4.2 | |||
| Party | Candidate | Votes | % | ± | |
|---|---|---|---|---|---|
Conservative | John Eldon Gorst | 774 | 50.6 | −0.6 | |
Liberal | Robert Torrens | 755 | 49.4 | +0.6 | |
| Majority | 19 | 1.2 | +0.1 | ||
Turnout | 1,529 | 86.4 | +2.4 | ||
Registered electors | 1,769 | ||||
Conservative hold | Swing | −0.6 | |||
Election of William Forsyth declared void on petition, due to his holding an office of profit under the Crown.
| Party | Candidate | Votes | % | ± | |
|---|---|---|---|---|---|
Conservative | William Forsyth | 762 | 25.6 | −0.8 | |
Conservative | Francis Powell | 760 | 25.6 | −0.7 | |
Liberal | Robert Torrens | 726 | 24.4 | +0.5 | |
Liberal | William Dougal Christie | 725 | 24.4 | +1.0 | |
| Majority | 34 | 1.1 | −1.2 | ||
Turnout | 1,487 (est) | 84.0 (est) | +4.6 | ||
Registered electors | 1,769 | ||||
Conservative hold | Swing | −0.8 | |||
Conservative hold | Swing | −0.7 | |||
| Party | Candidate | Votes | % | ± | |
|---|---|---|---|---|---|
Conservative | Francis Powell | 708 | 53.0 | +0.3 | |
Liberal | Henry Fawcett | 627 | 47.0 | −0.3 | |
| Majority | 81 | 6.1 | +3.8 | ||
Turnout | 1,335 | 72.9 | −6.5 | ||
Registered electors | 1,831 | ||||
Conservative hold | Swing | +0.3 | |||
Resignation of Andrew Steuart.
Elections in the 1850s
2010s – 2000s – 1990s – 1980s – 1970s – 1960s – 1950s – 1940s – 1930s – 1920s – 1910s – 1900s – 1890s – 1880s – 1870s – 1860s– 1850s– 1840s– 1830s– 1820s– 1810s– 1800s– 1790s– 1780s– 1770s– 1760s– 1750s– Back to Top |
| Party | Candidate | Votes | % | ± | |
|---|---|---|---|---|---|
Conservative | Kenneth Macaulay | 753 | 26.4 | +0.2 | |
Conservative | Andrew Steuart | 750 | 26.3 | +1.3 | |
Liberal | Edward Turner Boyd Twisleton | 683 | 23.9 | −0.9 | |
Liberal | Francis Mowatt | 669 | 23.4 | −0.5 | |
| Majority | 67 | 2.3 | +2.1 | ||
Turnout | 1,428 (est) | 79.4 (est) | +1.2 | ||
Registered electors | 1,797 | ||||
Conservative hold | Swing | +0.5 | |||
Conservative hold | Swing | +1.0 | |||
| Party | Candidate | Votes | % | ± | |
|---|---|---|---|---|---|
Conservative | Kenneth Macaulay | 770 | 26.2 | −0.9 | |
Conservative | Andrew Steuart | 735 | 25.0 | −1.5 | |
Radical | Robert Adair | 729 | 24.8 | +0.5 | |
Radical | J. T. Hibbert[58][17] | 702 | 23.9 | +1.7 | |
| Majority | 6 | 0.2 | −2.6 | ||
Turnout | 1,468 (est) | 78.2 (est) | +1.7 | ||
Registered electors | 1,878 | ||||
Conservative hold | Swing | −1.0 | |||
Conservative hold | Swing | −1.3 | |||
| Party | Candidate | Votes | % | ± | |
|---|---|---|---|---|---|
Radical | Robert Adair | 758 | 26.2 | +1.9 | |
Radical | Francis Mowatt | 733 | 25.3 | +3.1 | |
Conservative | George Finch-Hatton | 708 | 24.5 | −2.6 | |
Conservative | Frederic William Slade[59] | 696 | 24.0 | −2.5 | |
| Majority | 25 | 0.9 | N/A | ||
Turnout | 1,448 (est) | 73.2 (est) | −3.3 | ||
Registered electors | 1,977 | ||||
Radical gain from Conservative | Swing | +2.2 | |||
Radical gain from Conservative | Swing | +2.8 | |||
Previous election declared void on petition, due to bribery and treating. [15]
| Party | Candidate | Votes | % | ± | |
|---|---|---|---|---|---|
Conservative | Kenneth Macaulay | 821 | 27.1 | +15.5 | |
Conservative | John Harvey Astell | 803 | 26.5 | +14.9 | |
Whig | Robert Adair | 737 | 24.3 | −52.5 | |
Radical | Francis Mowatt | 673 | 22.2 | N/A | |
| Majority | 84 | 2.8 | N/A | ||
Turnout | 1,517 (est) | 76.5 (est) | +9.2 | ||
Registered electors | 1,984 | ||||
Conservative gain from Whig | Swing | +20.9 | |||
Conservative gain from Whig | Swing | +20.6 | |||
Elections in the 1840s
2010s – 2000s – 1990s – 1980s – 1970s – 1960s – 1950s – 1940s – 1930s – 1920s – 1910s – 1900s – 1890s – 1880s – 1870s – 1860s– 1850s– 1840s– 1830s– 1820s– 1810s– 1800s– 1790s– 1780s– 1770s– 1760s– 1750s– Back to Top |
| Party | Candidate | Votes | % | ± | |
|---|---|---|---|---|---|
Whig | Robert Adair | 811 | 40.5 | +16.0 | |
Whig | William Campbell | 727 | 36.3 | +13.1 | |
Conservative | John Manners-Sutton | 465 | 23.2 | −29.1 | |
| Majority | 262 | 13.1 | N/A | ||
| Majority | 1,234 (est) | 67.3 (est) | −6.4 | ||
Registered electors | 1,834 | ||||
Whig gain from Conservative | Swing | +15.3 | |||
Whig gain from Conservative | Swing | +13.8 | |||
| Party | Candidate | Votes | % | ± | |
|---|---|---|---|---|---|
Conservative | Fitzroy Kelly | 746 | 50.6 | −1.7 | |
Whig | Robert Adair | 729 | 49.4 | +1.7 | |
| Majority | 17 | 1.2 | +0.2 | ||
Turnout | 1,475 | 77.5 | +3.8 | ||
Registered electors | 1,904 | ||||
Conservative hold | Swing | −1.7 | |||
By-election triggered by the appointment of Fitzroy Kelly as Solicitor-General of England and Wales
| Party | Candidate | Votes | % | ± | |
|---|---|---|---|---|---|
Conservative | Fitzroy Kelly | 713 | 51.2 | −1.1 | |
Whig | Richard Foster | 680 | 48.8 | +1.1 | |
| Majority | 33 | 2.4 | +1.4 | ||
Turnout | 1,393 | 73.2 | −0.5 | ||
Registered electors | 1,904 | ||||
Conservative hold | Swing | −1.1 | |||
By-election triggered by the resignation of Sir Alexander Cray Grant, Bt. by accepting the office of Steward of the Manor of Poynings
| Party | Candidate | Votes | % | ± | |
|---|---|---|---|---|---|
Conservative | John Manners-Sutton | 758 | 26.8 | ||
Conservative | Alexander Grant | 722 | 25.5 | ||
Whig | Richard Foster | 695 | 24.5 | ||
Whig | Cosmo Russell | 656 | 23.2 | ||
| Majority | 27 | 1.0 | N/A | ||
Turnout | 1,430 | 73.7 | |||
Registered electors | 1,940 | ||||
Conservative gain from Whig | Swing | ||||
Conservative gain from Whig | Swing | ||||
| Party | Candidate | Votes | % | ± | |
|---|---|---|---|---|---|
Conservative | Alexander Grant | 736 | 52.8 | ||
Whig | Thomas Starkie | 657 | 47.2 | ||
| Majority | 79 | 5.7 | |||
Turnout | 1,393 | 75.0 | |||
Registered electors | 1,857 | ||||
Conservative gain from Whig | Swing | ||||
Previous by-election declared void on petition due to bribery and treating by Manners-Sutton's agents. [60]
Elections in the 1830s
2010s – 2000s – 1990s – 1980s – 1970s – 1960s – 1950s – 1940s – 1930s – 1920s – 1910s – 1900s – 1890s – 1880s – 1870s – 1860s– 1850s– 1840s– 1830s– 1820s– 1810s– 1800s– 1790s– 1780s– 1770s– 1760s– 1750s– Back to Top |
| Party | Candidate | Votes | % | ± | |
|---|---|---|---|---|---|
Tory | James Graham | Unopposed | N/A | N/A | |
Tory | Frederick Trench | Unopposed | N/A | N/A | |
| Majority | N/A | N/A | N/A | ||
| Majority | N/A | N/A | N/A | ||
Registered electors | c.160 | ||||
Tory hold | Swing | ||||
Tory hold | Swing | ||||
| Party | Candidate | Votes | % | ± | |
|---|---|---|---|---|---|
Whig | Thomas Spring Rice | 979 | |||
Whig | George Pryme | 709 | |||
Tory | Edward Sugden | 540 | |||
| Majority | 439 | ||||
| Majority | 169 | ||||
Registered electors | 1,499 | ||||
Whig gain from Tory | Swing | ||||
Whig gain from Tory | Swing | ||||
By-election triggered by the appointment of Thomas Spring Rice as Secretary of State for War and the Colonies.
| Party | Candidate | Votes | % | ± | |
|---|---|---|---|---|---|
Whig | Thomas Spring Rice | 615 | |||
Tory | Edward Sugden | 590 | |||
| Majority | 25 | ||||
Registered electors | 1,482 | ||||
Whig hold | Swing | ||||
| Party | Candidate | Votes | % | ± | |
|---|---|---|---|---|---|
Whig | Thomas Spring Rice | 736 | |||
Whig | George Pryme | 693 | |||
Tory | James Knight | 688 | |||
| Majority | 48 | ||||
| Majority | 5 | ||||
Registered electors | 1,482 | ||||
Whig hold | Swing | ||||
Whig hold | Swing | ||||
By-election triggered by the appointment of Thomas Spring Rice as Chancellor of the Exchequer.
| Party | Candidate | Votes | % | ± | |
|---|---|---|---|---|---|
Whig | Thomas Spring Rice | Unopposed | N/A | N/A | |
Registered electors | N/A | ||||
Whig hold | Swing | N/A | |||
| Party | Candidate | Votes | % | ± | |
|---|---|---|---|---|---|
Whig | Thomas Spring Rice | 690 | |||
Whig | George Pryme | 678 | |||
Tory | James Knight | 614 | |||
Tory | John Manners-Sutton | 599 | |||
| Majority | 76 | ||||
| Majority | 64 | ||||
Registered electors | 1,698 | ||||
Whig hold | Swing | ||||
Whig hold | Swing | ||||
By-election triggered by the elevation to the peerage of Thomas Spring Rice as Lord Monteagle of Brandon.
| Party | Candidate | Votes | % | ± | |
|---|---|---|---|---|---|
Tory | John Manners-Sutton | 717 | |||
Whig | T.M. Gibson | 617 | |||
| Majority | 100 | ||||
Registered electors | 1,698 | ||||
Tory gain from Whig | Swing | ||||
Elections in the 1820s
2010s – 2000s – 1990s – 1980s – 1970s – 1960s – 1950s – 1940s – 1930s – 1920s – 1910s – 1900s – 1890s – 1880s – 1870s – 1860s– 1850s– 1840s– 1830s– 1820s– 1810s– 1800s– 1790s– 1780s– 1770s– 1760s– 1750s– Back to Top |
| Party | Candidate | Votes | % | ± | |
|---|---|---|---|---|---|
Tory | Frederick Trench | 37 | |||
Tory | Charles Cheere | 37 | |||
Whig | Henry John Adeane | 18 | |||
Whig | George Pryme | 16 | |||
| Majority | 19 | ||||
| Majority | 19 | ||||
Registered electors | c.160 | ||||
Tory hold | Swing | ||||
Tory hold | Swing | ||||
By-election triggered by the death of Charles Madryl Cheere.
| Party | Candidate | Votes | % | ± | |
|---|---|---|---|---|---|
Tory | James Graham | Unopposed | N/A | N/A | |
| Majority | N/A | N/A | N/A | ||
Registered electors | c.160 | ||||
Tory hold | Swing | ||||
| Party | Candidate | Votes | % | ± | |
|---|---|---|---|---|---|
Tory | James Graham | 24 | |||
Tory | Frederick Trench | 23 | |||
Whig | George Pryme | 4 | |||
| Majority | 20 | ||||
| Majority | 19 | ||||
Registered electors | c.160 | ||||
Tory hold | Swing | ||||
Tory hold | Swing | ||||
By-election triggered by the appointment of the Marquess of Graham as Commander of the Board of Control.
| Party | Candidate | Votes | % | ± | |
|---|---|---|---|---|---|
Tory | James Graham | Unopposed | N/A | N/A | |
| Majority | N/A | N/A | N/A | ||
Registered electors | c.160 | ||||
Tory hold | Swing | ||||
By-election triggered by the appointment of Frederick William Trench as Storekeeper of Ordnance.
| Party | Candidate | Votes | % | ± | |
|---|---|---|---|---|---|
Tory | Frederick Trench | Unopposed | N/A | N/A | |
| Majority | N/A | N/A | N/A | ||
Registered electors | c.160 | ||||
Tory hold | Swing | ||||
Elections in the 1810s
2010s – 2000s – 1990s – 1980s – 1970s – 1960s – 1950s – 1940s – 1930s – 1920s – 1910s – 1900s – 1890s – 1880s – 1870s – 1860s– 1850s– 1840s– 1830s– 1820s– 1810s– 1800s– 1790s– 1780s– 1770s– 1760s– 1750s– Back to Top |
| Party | Candidate | Votes | % | ± | |
|---|---|---|---|---|---|
Tory | Edward Finch | Unopposed | N/A | ||
Tory | Robert Manners | Unopposed | N/A | ||
| Majority | N/A | N/A | N/A | ||
| Majority | N/A | N/A | N/A | ||
Registered electors | c.150 | ||||
Tory hold | Swing | N/A | |||
Tory hold | Swing | N/A | |||
| Party | Candidate | Votes | % | ± | |
|---|---|---|---|---|---|
Tory | Edward Finch | 76 | N/A | ||
Tory | Robert Manners | 76 | N/A | ||
Whig | Henry John Adeane | 56 | N/A | ||
| Majority | 20 | N/A | |||
| Majority | 20 | N/A | |||
Registered electors | c.150 | ||||
Tory hold | Swing | N/A | |||
Tory hold | Swing | N/A | |||
By-election triggered by the resignation of the Hon. Edward Finch.
| Party | Candidate | Votes | % | ± | |
|---|---|---|---|---|---|
Tory | Frederick Trench | Unopposed | N/A | N/A | |
| Majority | N/A | N/A | N/A | ||
Registered electors | c.150 | ||||
Tory hold | Swing | ||||
Elections in the 1800s
2010s – 2000s – 1990s – 1980s – 1970s – 1960s – 1950s – 1940s – 1930s – 1920s – 1910s – 1900s – 1890s – 1880s – 1870s – 1860s– 1850s– 1840s– 1830s– 1820s– 1810s– 1800s– 1790s– 1780s– 1770s– 1760s– 1750s– Back to Top |
By-election triggered by the appointment of Robert Manners as First Equerry and Clerk Marshal of the Mews.
| Party | Candidate | Votes | % | ± | |
|---|---|---|---|---|---|
Tory | Robert Manners | Unopposed | N/A | N/A | |
| Majority | N/A | N/A | N/A | ||
Registered electors | c.150 | ||||
Tory hold | Swing | ||||
| Party | Candidate | Votes | % | ± | |
|---|---|---|---|---|---|
Tory | Edward Finch | Unopposed | N/A | ||
Tory | Robert Manners | Unopposed | N/A | ||
| Majority | N/A | N/A | N/A | ||
| Majority | N/A | N/A | N/A | ||
Registered electors | c.150 | ||||
Tory hold | Swing | N/A | |||
Tory hold | Swing | N/A | |||
| Party | Candidate | Votes | % | ± | |
|---|---|---|---|---|---|
Tory | Edward Finch | Unopposed | N/A | ||
Tory | Robert Manners | Unopposed | N/A | ||
| Majority | N/A | N/A | N/A | ||
| Majority | N/A | N/A | N/A | ||
Registered electors | c.150 | ||||
Tory hold | Swing | N/A | |||
Tory hold | Swing | N/A | |||
Elections in the 1790s
2010s – 2000s – 1990s – 1980s – 1970s – 1960s – 1950s – 1940s – 1930s – 1920s – 1910s – 1900s – 1890s – 1880s – 1870s – 1860s– 1850s– 1840s– 1830s– 1820s– 1810s– 1800s– 1790s– 1780s– 1770s– 1760s– 1750s– Back to Top |
| Party | Candidate | Votes | % | ± | |
|---|---|---|---|---|---|
Tory | Edward Finch | Unopposed | N/A | ||
Tory | Francis Dickins | Unopposed | N/A | ||
| Majority | N/A | N/A | N/A | ||
| Majority | N/A | N/A | N/A | ||
Registered electors | c.150 | ||||
Tory hold | Swing | N/A | |||
Tory hold | Swing | N/A | |||
By-election triggered by the simultaneous election of Francis Dickins for Northamptonshire, and his decision to sit for that constituency instead of Cambridge.
| Party | Candidate | Votes | % | ± | |
|---|---|---|---|---|---|
Tory | Robert Manners | Unopposed | N/A | N/A | |
| Majority | N/A | N/A | N/A | ||
Registered electors | c.150 | ||||
Tory hold | Swing | ||||
| Party | Candidate | Votes | % | ± | |
|---|---|---|---|---|---|
Tory | Edward Finch | Unopposed | N/A | ||
Tory | Robert Manners | Unopposed | N/A | ||
| Majority | N/A | N/A | N/A | ||
| Majority | N/A | N/A | N/A | ||
Registered electors | c.150 | ||||
Tory hold | Swing | N/A | |||
Tory hold | Swing | N/A | |||
Elections in the 1780s
2010s – 2000s – 1990s – 1980s – 1970s – 1960s – 1950s – 1940s – 1930s – 1920s – 1910s – 1900s – 1890s – 1880s – 1870s – 1860s– 1850s– 1840s– 1830s– 1820s– 1810s– 1800s– 1790s– 1780s– 1770s– 1760s– 1750s– Back to Top |
| Party | Candidate | Votes | % | ± | |
|---|---|---|---|---|---|
Tory | James Whorwood Adeane | 96 | |||
| Nonpartisan | Benjamin Keene | 83 | |||
Whig | Christopher Potter | 18 | |||
| Majority | 78 | ||||
| Majority | 65 | ||||
Registered electors | c.150 | ||||
Tory hold | Swing | ||||
| Nonpartisan hold | Swing | ||||
| Party | Candidate | Votes | % | ± | |
|---|---|---|---|---|---|
Tory | James Whorwood Adeane | Unopposed | N/A | N/A | |
Tory | John Mortlock | Unopposed | N/A | N/A | |
| Majority | N/A | N/A | N/A | ||
| Majority | N/A | N/A | N/A | ||
Registered electors | c.150 | ||||
Tory hold | Swing | ||||
Tory gain from Nonpartisan | Swing | N/A | |||
By-election triggered by the appointment of John Mortlock to office.
| Party | Candidate | Votes | % | ± | |
|---|---|---|---|---|---|
Tory | Francis Dickins | 41 | |||
Whig | Thomas Adams | 7 | |||
| Majority | 34 | ||||
Registered electors | c.150 | ||||
Tory hold | Swing | ||||
By-election triggered by the appointment of James Whorwood Adeane to office.
| Party | Candidate | Votes | % | ± | |
|---|---|---|---|---|---|
Tory | Edward Finch | Unopposed | N/A | N/A | |
| Majority | N/A | N/A | N/A | ||
Registered electors | c.150 | ||||
Tory hold | Swing | ||||
Elections in the 1770s
2010s – 2000s – 1990s – 1980s – 1970s – 1960s – 1950s – 1940s – 1930s – 1920s – 1910s – 1900s – 1890s – 1880s – 1870s – 1860s– 1850s– 1840s– 1830s– 1820s– 1810s– 1800s– 1790s– 1780s– 1770s– 1760s– 1750s– Back to Top |
| Party | Candidate | Votes | % | ± | |
|---|---|---|---|---|---|
Tory | Soame Jenyns | 92 | |||
Whig | Charles Cadogan | 89 | |||
Whig | Thomas Byde | 63 | |||
| Nonpartisan | Samuel Meeke | 60 | |||
| Majority | 29 | ||||
| Majority | 26 | ||||
Registered electors | c.150 | ||||
Tory hold | Swing | ||||
Whig hold | Swing | ||||
By-election triggered by the elevation to the peerage of Charles Sloane Cadogan.
| Party | Candidate | Votes | % | ± | |
|---|---|---|---|---|---|
Nonpartisan | Benjamin Keene | 101 | |||
Whig | Thomas Byde | 34 | |||
| Majority | 67 | ||||
Registered electors | c.150 | ||||
| Nonpartisan hold | Swing | ||||
Elections in the 1760s
2010s – 2000s – 1990s – 1980s – 1970s – 1960s – 1950s – 1940s – 1930s – 1920s – 1910s – 1900s – 1890s – 1880s – 1870s – 1860s– 1850s– 1840s– 1830s– 1820s– 1810s– 1800s– 1790s– 1780s– 1770s– 1760s– 1750s– Back to Top |
| Party | Candidate | Votes | % | ± | |
|---|---|---|---|---|---|
Tory | Soame Jenyns | Unopposed | N/A | N/A | |
Whig | Charles Cadogan | Unopposed | N/A | N/A | |
| Majority | N/A | N/A | N/A | ||
| Majority | N/A | N/A | N/A | ||
Registered electors | c.150 | ||||
Tory gain from Whig | Swing | N/A | |||
Whig hold | Swing | ||||
By-election triggered by the appointment of Charles Sloane Cadogan to office.
| Party | Candidate | Votes | % | ± | |
|---|---|---|---|---|---|
Whig | Charles Cadogan | Unopposed | N/A | N/A | |
| Majority | N/A | N/A | N/A | ||
Registered electors | c.150 | ||||
Whig hold | Swing | ||||
| Party | Candidate | Votes | % | ± | |
|---|---|---|---|---|---|
Tory | Soame Jenyns | Unopposed | N/A | N/A | |
Whig | Charles Cadogan | Unopposed | N/A | N/A | |
| Majority | N/A | N/A | N/A | ||
| Majority | N/A | N/A | N/A | ||
Registered electors | c.150 | ||||
Tory hold | Swing | ||||
Whig hold | Swing | ||||
By-election triggered by the appointment of Charles Sloane Cadogan to office.
| Party | Candidate | Votes | % | ± | |
|---|---|---|---|---|---|
Whig | Charles Cadogan | Unopposed | N/A | N/A | |
| Majority | N/A | N/A | N/A | ||
Registered electors | c.150 | ||||
Whig hold | Swing | ||||
Elections in the 1750s
2010s – 2000s – 1990s – 1980s – 1970s – 1960s – 1950s – 1940s – 1930s – 1920s – 1910s – 1900s – 1890s – 1880s – 1870s – 1860s– 1850s– 1840s– 1830s– 1820s– 1810s– 1800s– 1790s– 1780s– 1770s– 1760s– 1750s– Back to Top |
| Party | Candidate | Votes | % | ± | |
|---|---|---|---|---|---|
Whig | Thomas Hay | Unopposed | N/A | N/A | |
Whig | Thomas Bromley | Unopposed | N/A | N/A | |
| Majority | N/A | N/A | N/A | ||
| Majority | N/A | N/A | N/A | ||
Registered electors | c.150 | ||||
Whig hold | Swing | ||||
Whig hold | Swing | ||||
By-election triggered by the succession to the peerage of Thomas Bromley.
| Party | Candidate | Votes | % | ± | |
|---|---|---|---|---|---|
Whig | Charles Cadogan | Unopposed | N/A | N/A | |
| Majority | N/A | N/A | N/A | ||
Registered electors | c.150 | ||||
Whig hold | Swing | ||||
By-election triggered by the appointment of Thomas Hay, Viscount Dupplin, to office.
| Party | Candidate | Votes | % | ± | |
|---|---|---|---|---|---|
Whig | Thomas Hay | Unopposed | N/A | N/A | |
| Majority | N/A | N/A | N/A | ||
Registered electors | c.150 | ||||
Whig hold | Swing | ||||
By-election triggered by the appointment of Thomas Hay, Viscount Dupplin, to office.
| Party | Candidate | Votes | % | ± | |
|---|---|---|---|---|---|
Whig | Thomas Hay | Unopposed | N/A | N/A | |
| Majority | N/A | N/A | N/A | ||
Registered electors | c.150 | ||||
Whig hold | Swing | ||||
By-election triggered by the succession to the peerage Thomas Hay, Viscount Dupplin.
| Party | Candidate | Votes | % | ± | |
|---|---|---|---|---|---|
Whig | Charles Cadogan | Unopposed | N/A | N/A | |
| Majority | N/A | N/A | N/A | ||
Registered electors | c.150 | ||||
Whig hold | Swing | ||||
Graphical representation
| 24.7% | 75.3% |
Liberal | Conservative |
| 31.1% | 20.2% | 48.7% |
Labour | Liberal | Conservative |
| 20.9% | 30.4% | 48.8% |
Labour | Liberal | Conservative |
| 24.5% | 33.6% | 41.9% |
Labour | Liberal | Conservative |
| 19.4% | 28.1% | 52.5% |
Labour | Liberal | Conservative |
| 31.5% | 25.3% | 43.2% |
Labour | Liberal | Conservative |
| 26.8% | 73.2% |
Labour | Conservative |
| 41.5% | 58.5% |
Labour | Conservative |
50.9% | 49.1% |
Labour | Conservative |
| 40.0% | 10.5% | 49.5% |
Labour | Liberal | Conservative |
| 41.2% | 6.4% | 52.4% |
Labour | Liberal | Conservative |
| 42.4% | 57.6% |
Labour | Conservative |
| 36.8% | 12.2% | 51.1% |
Labour | Liberal | Conservative |
| 40.5% | 16.2% | 43.4% |
Labour | Liberal | Conservative |
45.5% | 10.2% | 43.4% | |
Labour | Liberal | Conservative |
| 36.6% | 11.8% | 51.6% |
Labour | Liberal | Conservative |
| 44.7% | 55.3% |
Labour | Conservative |
| 32.7% | 26.1% | 40.6% | |
Labour | Liberal | Conservative |
| 36.0% | 21.1% | 1.7 | 41.3% |
Labour | Liberal | UDP | Conservative |
| 26.0% | 18.3% | 1.9 | 51.0% | 1.8 | |
Labour | Liberal | Ind | Conservative | NF |
| 37.1% | 16.6% | 45.7% | |
Labour | Liberal | Conservative |
| 28.2% | 29.7% | 41.5% | |
Labour | SDP | Conservative |
| 1.1 | 28.3% | 30.6% | 40.0% |
Gn | Labour | SDP | Conservative |
| 1.4 | 39.7% | 19.9% | 38.5% | |
Gn | Labour | Lib Dems | Conservative |
| 1.3 | 53.4% | 16.1% | 25.9% | 2.5 | |
Gn | Labour | Lib Dems | Conservative | Ref |
| 1.7 | 3.3 | 45.1% | 25.1% | 22.9% | 1.2 | |
SA | Gn | Labour | Lib Dems | Conservative | UK |
| 2.9 | 1.1 | 34.0% | 44.0% | 16.5% | 1.3 | |
Gn | Rs | Labour | Lib Dems | Conservative | UK |
| 7.6% | 24.3% | 39.1% | 25.6% | 2.4 | |
Green | Labour | Lib Dems | Conservative | UK |
| 7.9% | 36.0% | 34.9% | 15.7% | 5.2% | |
Green | Labour | Lib Dems | Conservative | UKIP |
| 2.2 | 51.9% | 29.3% | 16.3% | |
Gn | Labour | Lib Dems | Conservative |
See also
- List of Parliamentary constituencies in Cambridgeshire
Notes and references
- Notes
^ As with all constituencies, Cambridge elects one Member of Parliament (MP) by the first past the post system of election at least every five years. It is a borough constituency rather than county constituency which determines the exact level of election expenses available and the type of returning officer appointed for the count.
^ Old Holborn is the name of a popular libertarian blog, and the author of the blog stood for election under the name of his blog, rather than his own name.
- References
^ "Cambridge: Usual Resident Population, 2011". Neighbourhood Statistics. Office for National Statistics. Retrieved 9 February 2015..mw-parser-output cite.citation{font-style:inherit}.mw-parser-output q{quotes:"""""""'""'"}.mw-parser-output code.cs1-code{color:inherit;background:inherit;border:inherit;padding:inherit}.mw-parser-output .cs1-lock-free a{background:url("//upload.wikimedia.org/wikipedia/commons/thumb/6/65/Lock-green.svg/9px-Lock-green.svg.png")no-repeat;background-position:right .1em center}.mw-parser-output .cs1-lock-limited a,.mw-parser-output .cs1-lock-registration a{background:url("//upload.wikimedia.org/wikipedia/commons/thumb/d/d6/Lock-gray-alt-2.svg/9px-Lock-gray-alt-2.svg.png")no-repeat;background-position:right .1em center}.mw-parser-output .cs1-lock-subscription a{background:url("//upload.wikimedia.org/wikipedia/commons/thumb/a/aa/Lock-red-alt-2.svg/9px-Lock-red-alt-2.svg.png")no-repeat;background-position:right .1em center}.mw-parser-output .cs1-subscription,.mw-parser-output .cs1-registration{color:#555}.mw-parser-output .cs1-subscription span,.mw-parser-output .cs1-registration span{border-bottom:1px dotted;cursor:help}.mw-parser-output .cs1-hidden-error{display:none;font-size:100%}.mw-parser-output .cs1-visible-error{font-size:100%}.mw-parser-output .cs1-subscription,.mw-parser-output .cs1-registration,.mw-parser-output .cs1-format{font-size:95%}.mw-parser-output .cs1-kern-left,.mw-parser-output .cs1-kern-wl-left{padding-left:0.2em}.mw-parser-output .cs1-kern-right,.mw-parser-output .cs1-kern-wl-right{padding-right:0.2em}
^ "Electorate Figures – Boundary Commission for England". 2011 Electorate Figures. Boundary Commission for England. 4 March 2011. Archived from the original on 6 November 2010. Retrieved 13 March 2011.
^ List of Labour MPs elected in 2015 by % majority UK Political.info. Retrieved 2017-01-29
^ abcdefghijklmnopqrstuvwxy "History of Parliament". Retrieved 2011-09-21.
^ abcdefghijklmn "History of Parliament". Retrieved 2011-09-21.
^ abcdefghij "History of Parliament". Retrieved 2011-09-21.
^ abc Leigh Rayment's Historical List of MPs – Constituencies beginning with "C" (part 1)
^ abcdefghijklmnopqrstu Stooks Smith, Henry. (1973) [1844-1850]. Craig, F. W. S., ed. The Parliaments of England (2nd ed.). Chichester: Parliamentary Research Services. pp. 25–28. ISBN 0-900178-13-2.
^ Churton, Edward (1838). The Assembled Commons or Parliamentary Biographer: 1838. p. 190. Retrieved 29 October 2018 – via Google Books.
^ Wahrman, Dror (1995). "Against the tide". Imagining the Middle Class: The Political Representation of Class in Britain, c. 1780–1840. Cambridge: Cambridge University Press. p. 44. ISBN 0-521-47127-3. Retrieved 22 April 2018.
^ Hutchinson, Wesley (2014). "'And this in thriving and prosperous Antrim!': An Anglo-Irish landlord's perspective on the famine". Revue Française de Civilisation Britannique. XIX-2: 89–105. doi:10.400/rfcb.263.
^ "Whig Meeting at the Hoop". Cambridge Chronicle and Journal. 24 July 1847. p. 2. Retrieved 22 April 2018 – via British Newspaper Archive. (Subscription required (help)).
^ ab "Cambridge". The Suffolk Chronicle. 24 July 1847. pp. 1–2. Retrieved 22 April 2018 – via British Newspaper Archive. (Subscription required (help)).
^ ab "The Borough Election". Cambridge Independent Press. 31 July 1847. p. 2. Retrieved 22 April 2018 – via British Newspaper Archive. (Subscription required (help)).
^ ab "Writ suspended". Hampshire Chronicle. 5 March 1853. p. 2. Retrieved 22 April 2018 – via British Newspaper Archive. (Subscription required (help)).
^ ab "Review of the Corn Trade". Cambridge Chronicle and Journal. 21 March 1857. pp. 3–4. Retrieved 22 April 2018 – via British Newspaper Archive. (Subscription required (help)).
^ ab Lane, Andrew Jonathan (1992). "The development of democracy as a political ideal in the second half of the nineteenth century: with special reference to Cambridgeshire, Huntingdonshire, and Co. Durham" (PDF). Durham E-Theses Online. Durham University. pp. 97, 211. Retrieved 22 April 2018.
^ "The Elections". Berkshire Chronicle. 19 August 1854. p. 8. Retrieved 22 April 2018 – via British Newspaper Archive. (Subscription required (help)).
^ Collet, Collet Dobson (1899). History of the Taxes on Knowledge: Their Origin and Repeal. London: T. Fisher Unwin. p. 93. Retrieved 22 April 2018.
^ "Francis Mowatt". Cambridge Chronicle and Journal. 5 August 1854. pp. 4–5. Retrieved 22 April 2018 – via British Newspaper Archive. (Subscription required (help)).
^ "Cambridge 1660-". Hansard 1803–2005. UK Parliament. Retrieved 9 February 2015.
^ [1]
^ "Six Lib Dem MPs selected to fight their former constituencies".
^ "Cambridge Green Party select new Parliamentary Candidate". cambridge.greenparty.org.uk.
^ Thomas, Josh (5 May 2017). "Conservative candidate announced for Cambridge parliamentary race".
^ "Candidates standing in the General Election in Cambridgeshire".
^ "Election Data 2015". Electoral Calculus. Archived from the original on 17 October 2015. Retrieved 17 October 2015.
^ "Cambridge News – News, Sport and Events from around Cambridge". www.cambridge-news.co.uk. Archived from the original on 2015-04-14.
^ "Cambridge – Statement of Persons Nominated" (PDF). Archived from the original (PDF) on 2012-03-05.
^ ab "'Cambridge', June 1983 up to May 1997". ElectionWeb Project. Cognitive Computing Limited. Retrieved 4 March 2016.
^ abc "'Cambridge', Feb 1974 – May 1983". ElectionWeb Project. Cognitive Computing Limited. Archived from the original on 30 March 2016. Retrieved 20 March 2016.
^ "UK General Election results 1979". Politics Resources. Retrieved 20 March 2016.
^ "UK General Election results October 1974". Politics Resources. Retrieved 20 March 2016.
^ "UK General Election results February 1974". Politics Resources. Retrieved 20 March 2016.
^ abcdefghijklmnop "Cambridge BCon/PBCon through time – Political Life Statistics – Groupings of Political Parties". A Vision of Britain through Time. GB Historical GIS / University of Portsmouth. Retrieved 14 April 2016.
^ abcdefghijklmnop "Cambridge BCon/PBCon through time – Political Life Statistics – Total Electorate". A Vision of Britain through Time. GB Historical GIS / University of Portsmouth. Retrieved 14 April 2016.
^ Kimber, Richard. "UK General Election results 1970". Political Science Resources. Retrieved 14 April 2016.
^ http://tools.assembla.com/svn/grodt/uk/thc/files/marked_up/1970_marked_up.txt
^ "1967 By Election Results". Archived from the original on 2012-03-29. Retrieved 2015-08-20.
^ Kimber, Richard. "UK General Election results 1966". Political Science Resources. Retrieved 14 April 2016.
^ http://tools.assembla.com/svn/grodt/uk/thc/files/marked_up/1966_marked_up.txt
^ Kimber, Richard. "UK General Election results 1964". Political Science Resources. Retrieved 14 April 2016.
^ http://tools.assembla.com/svn/grodt/uk/thc/files/marked_up/1964_marked_up.txt
^ Kimber, Richard. "UK General Election results 1959". Political Science Resources. Retrieved 14 April 2016.
^ http://tools.assembla.com/svn/grodt/uk/thc/files/marked_up/1959_marked_up.txt
^ Kimber, Richard. "UK General Election results 1955". Political Science Resources. Retrieved 14 April 2016.
^ http://tools.assembla.com/svn/grodt/uk/thc/files/marked_up/1955_marked_up.txt
^ Kimber, Richard. "UK General Election results 1951". Political Science Resources. Retrieved 14 April 2016.
^ http://tools.assembla.com/svn/grodt/uk/thc/files/marked_up/1951_marked_up.txt
^ Kimber, Richard. "UK General Election results 1950". Political Science Resources. Retrieved 14 April 2016.
^ http://tools.assembla.com/svn/grodt/uk/thc/files/marked_up/1950_marked_up.txt
^ Kimber, Richard. "UK General Election results 1945". Political Science Resources. Retrieved 14 April 2016.
^ Kimber, Richard. "UK General Election results 1935". Political Science Resources. Retrieved 14 April 2016.
^ Kimber, Richard. "UK General Election results 1931". Political Science Resources. Retrieved 14 April 2016.
^ abcdefghi Craig, FWS, ed. (1974). British Parliamentary Election Results 1885–1918 (ebook). London and Basingstoke: Palgrave Macmillan. ISBN 978-1-349-02300-4.
^ "Contest in the Borough". Cambridge Independent Press. 26 Jun 1886. p. 2. Retrieved 24 November 2017.
^ abcdefghijklmno Craig, F. W. S., ed. (1977). British Parliamentary Election Results 1832-1885 (e-book) (1st ed.). London: Macmillan Press. ISBN 978-1-349-02349-3.
^ Seaman, L. C. B. (2002). Victorian England: Aspects of English and Imperial History, 1837-1901. Routledge. p. 177. ISBN 9781134947904. Retrieved 22 April 2018.
^ "To Builders". Cambridge Chronicle and Journal. 5 August 1854. p. 5. Retrieved 22 April 2018 – via British Newspaper Archive. (Subscription required (help)).
^ "Cambridge Election Committee". Bradford Observer. 7 May 1840. p. 1. Retrieved 29 October 2018 – via British Newspaper Archive. (Subscription required (help)).
- Sources
"Constituencies in the unreformed House". Date of creation. Archived from the original on February 7, 2005. Retrieved 4 July 2005.
External links
nomis Constituency Profile for Cambridge — presenting data from the ONS annual population survey and other official statistics.- Cambridge Constituency Parliamentary Elections since 1832


