Two-party-preferred vote
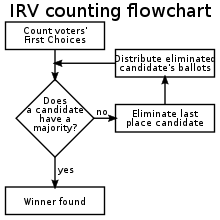
Instant-runoff voting method. TPP/TCP vote is calculated when two candidates remain.
In Australian politics, the two-party-preferred vote (TPP or 2PP) is the result of an election or opinion poll after preferences have been distributed to the highest two candidates, who in some cases can be independents. For the purposes of TPP, the Liberal/National Coalition is usually considered a single party, with Labor being the other major party. Typically the TPP is expressed as the percentages of votes attracted by each of the two major parties, e.g. "Coalition 45%, Labor 55%", where the values include both primary votes and preferences. The TPP is an indicator of how much swing has been attained/is required to change the result, taking into consideration preferences, which may have a significant effect on the result.
The TPP assumes a two-party system, i.e. that after distribution of votes from less successful candidates, the two remaining candidates will be from the two major parties. However, in some electorates this is not the case. The two-candidate-preferred vote (TCP) is the result after preferences have been distributed, using instant-runoff voting, to the final two candidates, regardless of which party the candidates represent. For electorates where the two candidates are from the major parties, the TCP is also the TPP. For electorates where these two candidates are not both from the major parties, preferences are notionally distributed to the two major parties to determine the TPP. In this case the TPP differs from the TCP, and is not informative. TPP results above seat-level, such as a national or statewide TPP, are also informative only and have no direct effect on the election outcome.
The full allocation of preferences under instant-runoff voting is used in the lower houses of the Federal, Queensland, Victorian, Western Australian, South Australian, and Northern Territory parliaments, as well as the upper house of Tasmania. The New South Wales lower house uses optional-preference instant runoff voting – with some votes giving limited or no preferences, TPP/TCP is not as meaningful. TPP/TCP does not occur in the Tasmanian lower house or the Australian Capital Territory due to a different system altogether, the Hare-Clark proportional voting system. Aside from Tasmania, TPP/TCP is not used in any other upper houses in Australia, with most using the group ticket single transferable proportional voting system.[1]
Contents
1 History
2 Procedure
3 Analysis
4 Examples
4.1 Federal, Swan 1918
4.2 Federal, Adelaide 2004
4.3 South Australia, Frome 2009
4.4 Federal, Melbourne 2010
4.5 South Australia, Port Adelaide 2012
5 House of Representatives primary, two-party and seat results
6 See also
7 External links
8 References
History
Australia originally used first-past-the-post voting as used by the House of Commons of the United Kingdom. Federal election full-preference instant-runoff voting has been in existence since its introduction by the government after the 1918 Swan by-election. Candidates from the Australian Labor Party, the Nationalist Party government (predecessor to the United Australia Party and Liberal Party of Australia), and the emerging National Party of Australia (then Country Party) all received around a third of the vote, however Labor remained a few percent in front of both other candidates to win the seat. The system has allowed the two non-Labor parties to compete in many seats without splitting the conservative vote in three-cornered-contests. Even in landslide conservative election wins such as 1975 or 1996, Labor had the largest primary vote. The Coalition now comprises four parties: the Liberal Party of Australia except Queensland and the Northern Territory, the National Party of Australia in New South Wales and Victoria, the Liberal National Party of Queensland, and the Country Liberal Party in the Northern Territory. It is increasingly uncommon for seats to be contested by more than one Coalition candidate, by 2010 only three seats were contested by more than one Coalition candidate, all in New South Wales. Four seats were contested by the non-Coalition National Party of Western Australia, none were contested by the non-Coalition National Party of South Australia, and neither are automatically part of the Coalition TPP. Preferences have also been of significant relevance to the DLP, the Democrats, One Nation, the Greens, and independents.
Not distributing preferences was historically common in seats where a candidate received over 50 percent of the primary vote. Federal seat and national TPP results have only been produced as far back as 1937, though it was not uncommon in the next few decades for major parties at federal elections to not field a candidate in a few "safe" seats, but since 1972, all seats at federal elections have been contested by the major parties. Full preference distributions have occurred in all seats since 1983.[2]
South Australian state elections have boundaries strategically redrawn before each election with a fairness aim based on the prior election TPP vote, the only state to do so. The culmination of the historical state lower house seat malapportionment known as the Playmander eventually saw it legislated after 1989 that the Electoral Commission of South Australia redraw boundaries after each election with the objective of the party that receives over 50 percent of the TPP vote at each forthcoming election forms government. Nationally in 1983/84, minor gerrymandering by incumbent federal governments was legislated against with the formation of the independent Commonwealth statutory authority, the Australian Electoral Commission.[3]
Procedure
Under the full-preference instant-runoff voting system, in each seat, the candidate with the lowest vote is eliminated and their preferences are distributed, which is repeated until only two candidates remain. Whilst every seat has a TCP result, seats where the major parties have come first and second are commonly referred to as having a TPP result. In a TCP contest between Labor and the NSW/Vic Nationals and without a Liberal candidate, this is also considered a TPP, with the Nationals in these states considered a de facto major party within the Liberal/National Coalition. In seats where the major parties do not come first and second, differing TPP and TCP results are returned. When only one of two major parties contest a seat, such as at some by-elections, only a TCP result is produced. Swings in Australian parliaments are more commonly associated with the TPP vote. At the 2013 federal election, 11 of 150 seats returned differing TPP and TCP figures ("non-classic seats"), indicating a considerable two-party system.[4]
The tallying of seat TPP results gives a statewide and/or national TPP vote. Non-classic seats have votes redistributed for informational purposes to the major parties so that every seat has a TPP result. Whilst the TCP is the determining factor in deciding which candidate wins a seat, the overall election TPP is statistical and indicative only, as swings in seats are not uniform, and a varying range of factors can influence marginal seat wins with single-member electorates. Several federal elections since 1937 have seen a government elected with a minority of the TPP vote: 1940 (49.7%), 1954 (49.3%), 1961 (49.5%), 1969 (49.8%), 1990 (49.9%), and 1998 (49.0%).
As the TPP vote rather than the primary vote is a better indicator of who is in front with seats won and lost on a preferential basis, Australian opinion polls survey voter intention with a TPP always produced. However, these TPP figures tend to be calculated based on preference flows at the prior election rather than asked at the time of polling. There difference between the two is usually within the margin of error (usually +/– 3 percentage points). History has shown that prior election preference flows are more reliable.[5]
Analysis
After the count has taken place, it is possible to analyze the ultimate preference flows for votes cast for the parties that were ultimately excluded from the TPP calculation, in order to determine if the composite flow would have significantly affected the final result. Such an exercise is shown for the 2017 by-election in Bennelong:
| Party | Candidate | First preferences | % preference to | |||
|---|---|---|---|---|---|---|
| Votes | % | Liberal | Labor | |||
| | Greens | Justin Alick | 5,688 | 6.8 | 19.7 | 80.3 |
| | Conservatives | Joram Richa | 3,609 | 4.3 | 86.5 | 13.5 |
| | Christian Democrats | Gui Dong Cao | 2,626 | 3.1 | 72.4 | 27.6 |
| | Science | James Jansson | 1,041 | 1.2 | 39.4 | 60.6 |
| | Sustainable Australia | Wesley Folitarik | 995 | 1.2 | 48.9 | 51.1 |
| | Affordable Housing | Anthony Ziebell | 741 | 0.9 | 44.7 | 55.3 |
| | Liberty Alliance | Tony Robinson | 719 | 0.9 | 79.0 | 21.0 |
| | Progressives | Chris Golding | 425 | 0.5 | 42.1 | 57.9 |
| | People’s Party | James Platter | 186 | 0.2 | 48.9 | 51.1 |
| | Non-Custodial Parents | Anthony Fels | 132 | 0.2 | 56.1 | 43.9 |
Totals | 16,162 | 19.2 | 51.2 | 48.8 | ||
Examples
Federal, Swan 1918
| Party | Candidate | Votes | % | ± | |
|---|---|---|---|---|---|
Labor | Edwin Corboy | 6,540 | 34.4 | N/A | |
Country | Basil Murray | 5,975 | 31.4 | N/A | |
Nationalist | William Hedges | 5,635 | 29.6 | N/A | |
Independent | William Watson | 884 | 4.6 | N/A | |
Turnout | 19,213 | 64.3% | |||
Labor gain from Nationalist | Swing | N/A | |||
The result of the 1918 Swan by-election, the first-past-the-post election which caused the government of the day to introduce full-preference instant-runoff voting, under which Labor would have been easily defeated. Labor won the seat, and their majority was 3.0 points (34.4 minus 31.4). No swings are available as the Nationalists retained the seat unopposed at the previous election.
Federal, Adelaide 2004
| Party | Candidate | Votes | % | ± | |
|---|---|---|---|---|---|
Liberal | Trish Worth | 38,530 | 45.29 | +0.82 | |
Labor | Kate Ellis | 35,666 | 41.92 | +5.50 | |
Greens | Jake Bugden | 6,794 | 7.99 | +2.02 | |
Family First | Peter G Robins | 1,753 | 2.06 | +2.06 | |
Democrats | Richard Pascoe | 1,355 | 1.59 | –9.30 | |
Independent | Amanda Barlow | 978 | 1.15 | +1.15 | |
| Total formal votes | 85,076 | 95.60 | +0.66 | ||
| Informal votes | 3,920 | 4.40 | –0.66 | ||
Turnout | 88,996 | 93.62 | –1.09 | ||
Two-party-preferred result | |||||
Labor | Kate Ellis | 43,671 | 51.33 | +1.95 | |
Liberal | Trish Worth | 41,405 | 48.67 | –1.95 | |
Labor gain from Liberal | Swing | +1.95 | |||
It can be seen that the Liberal candidate had a primary vote lead over the Labor candidate. In a first-past-the-post vote, the Liberals would have retained the seat, and their majority would be said to be 3.4 points (45.3 minus 41.9).
However, under full-preference instant-runoff voting, the votes of all the minor candidates were distributed as follows:
| 2nd count: Barlow 978 votes distributed | ||||||
|---|---|---|---|---|---|---|
| Party | Candidate | Added votes | % | Votes | % | |
Liberal | Trish Worth | 172 | 17.6 | 38,702 | 45.5 | |
Labor | Kate Ellis | 206 | 21.1 | 35,872 | 42.2 | |
Greens | Jake Bugden | 365 | 37.3 | 7,159 | 8.4 | |
Family First | Peter G Robins | 96 | 9.8 | 1,849 | 2.2 | |
Democrats | Richard Pascoe | 139 | 14.2 | 1,494 | 1.8 | |
Total | 978 | 85,076 | ||||
| 3rd count: Democrats 1,494 votes distributed | ||||||
|---|---|---|---|---|---|---|
| Party | Candidate | Added votes | % | Votes | % | |
Liberal | Trish Worth | 343 | 23.0 | 39,045 | 45.9 | |
Labor | Kate Ellis | 494 | 33.1 | 36,366 | 42.8 | |
Greens | Jake Bugden | 560 | 37.5 | 7,719 | 9.1 | |
Family First | Peter G Robins | 97 | 6.5 | 1,946 | 2.3 | |
Total | 1,494 | 85,076 | ||||
| 4th count: Family First 1,946 votes distributed | ||||||
|---|---|---|---|---|---|---|
| Party | Candidate | Added votes | % | Votes | % | |
Liberal | Trish Worth | 1,098 | 56.4 | 40,143 | 47.2 | |
Labor | Kate Ellis | 377 | 19.4 | 36,743 | 43.2 | |
Greens | Jake Bugden | 471 | 24.2 | 8,190 | 9.6 | |
Total | 1,946 | 85,076 | ||||
| 5th count: Greens 8,190 votes distributed – final TPP/TCP | ||||||
|---|---|---|---|---|---|---|
| Party | Candidate | Added votes | % | Votes | % | |
Labor | Kate Ellis | 6,928 | 84.6 | 43,671 | 51.3 | |
Liberal | Trish Worth | 1,262 | 15.4 | 41,405 | 48.7 | |
Total | 8,190 | 85,076 | 1.3 | |||
The process of allocating the votes can be more succinctly shown thus:
| Party | Candidate | Count | ||||||
|---|---|---|---|---|---|---|---|---|
| 1st | 2nd | 3rd | 4th | 5th | Total | |||
| Labor | Kate Ellis | 35,666 | 206 | 494 | 377 | 6,928 | 43,671 | |
| Liberal | Trish Worth | 38,530 | 172 | 343 | 1,098 | 1,262 | 41,405 | |
| Greens | Jake Bugden | 6,794 | 365 | 560 | 471 | (8,190) | | |
| Family First | Peter G Robins | 1,753 | 96 | 97 | (1,946) | | ||
| Democrats | Richard Pascoe | 1,355 | 139 | (1,494) | | |||
| Independent | Amanda Barlow | 978 | (978) | | ||||
Thus, Labor defeated the Liberals, with 85 percent of Green and Green-preferenced voters preferencing Labor on the last distribution. Labor's TPP/TCP vote was 51.3 percent, a TPP/TCP majority of 1.3 points, and a TPP/TCP swing of 1.9 points compared with the previous election.
South Australia, Frome 2009
| Party | Candidate | Votes | % | ± | |
|---|---|---|---|---|---|
Liberal | Terry Boylan | 7,576 | 39.24 | –8.86 | |
Labor | John Rohde | 5,041 | 26.11 | –14.93 | |
Independent | Geoff Brock | 4,557 | 23.60 | +23.60 | |
National | Neville Wilson | 1,267 | 6.56 | +6.56 | |
Greens | Joy O'Brien | 734 | 3.80 | +0.06 | |
One Nation | Peter Fitzpatrick | 134 | 0.69 | +0.69 | |
| Total formal votes | 19,309 | 97.12 | +0.21 | ||
| Informal votes | 573 | 2.88 | –0.21 | ||
Turnout | 19,882 | 89.79 | –4.44 | ||
Two-party-preferred result | |||||
Liberal | Terry Boylan | 9,976 | 51.67 | –1.74 | |
Labor | John Rohde | 9,333 | 48.33 | +1.74 | |
Two-candidate-preferred result | |||||
Independent | Geoff Brock | 9,987 | 51.72 | +51.72 | |
Liberal | Terry Boylan | 9,322 | 48.28 | –5.13 | |
Independent gain from Liberal | Swing | N/A | |||
The 2009 Frome by-election was closely contested, with the result being uncertain for over a week.[9][10][11] Liberal leader Martin Hamilton-Smith claimed victory on behalf of the party.[12][13][14] The result hinged on the performance of Brock against Labor in the competition for second place. Brock polled best in the Port Pirie area, and received enough eliminated candidate preferences to end up ahead of the Labor candidate by 30 votes.
| Party | Candidate | Votes | % | ± | |
|---|---|---|---|---|---|
Liberal | Terry Boylan | 8,215 | 42.54 | ||
Independent | Geoff Brock | 5,562 | 28.81 | ||
Labor | John Rohde | 5,532 | 28.65 | ||
Brock received 80 percent of Labor's fifth count preferences to achieve a TCP vote of 51.72 percent (a majority of 665 votes) against the Liberal candidate.[16][17] The by-election saw a rare TPP swing to an incumbent government, and was the first time an opposition had lost a seat at a by-election in South Australia.[18][19] The result in Frome at the 2010 state election saw Brock come first on primary votes, increasing his primary vote by 14.1 points to a total of 37.7 percent and his TCP vote by 6.5 points to a total of 58.2 percent. Despite a statewide swing against Labor at the election, Labor again increased its TPP vote in Frome by 1.8 points to a total of 50.1 percent.
Federal, Melbourne 2010
| Party | Candidate | Votes | % | ± | |
|---|---|---|---|---|---|
Labor | Cath Bowtell | 34,022 | 38.09 | –11.42 | |
Greens | Adam Bandt | 32,308 | 36.17 | +13.37 | |
Liberal | Simon Olsen | 18,760 | 21.00 | –2.49 | |
Sex Party | Joel Murray | 1,633 | 1.83 | +1.83 | |
Family First | Georgia Pearson | 1,389 | 1.55 | +0.55 | |
Secular | Penelope Green | 613 | 0.69 | +0.69 | |
Democrats | David Collyer | 602 | 0.67 | –0.76 | |
| Total formal votes | 89,327 | 96.38 | –0.82 | ||
| Informal votes | 3,356 | 3.62 | +0.82 | ||
Turnout | 92,683 | 90.09 | –1.41 | ||
Two-party-preferred result | |||||
Labor | Cath Bowtell | 65,473 | 73.30 | +1.03 | |
Liberal | Simon Olsen | 23,854 | 26.70 | –1.03 | |
Two-candidate-preferred result | |||||
Greens | Adam Bandt | 50,059 | 56.04 | +10.75 | |
Labor | Cath Bowtell | 39,268 | 43.96 | –10.75 | |
Greens gain from Labor | Swing | +10.75 | |||
In this example, the two remaining candidates/parties, one a minor party, were the same after preference distribution at both this election and the previous election. Therefore, differing TPP and TCP votes, margins, and swings resulted.[20]
South Australia, Port Adelaide 2012
| Party | Candidate | Votes | % | ± | |
|---|---|---|---|---|---|
Labor | Susan Close | 8,218 | 42.3 | –7.6 | |
Independent | Gary Johanson | 4,717 | 24.3 | +24.3 | |
Independent | Sue Lawrie | 2,938 | 15.1 | +15.1 | |
Liberal Democrats | Stephen Humble | 1,415 | 7.3 | +7.3 | |
Greens | Justin McArthur | 1,096 | 5.6 | –0.6 | |
Independent | Colin Thomas | 314 | 1.6 | +1.6 | |
Independent | Bob Briton | 292 | 1.5 | +1.5 | |
One Nation | Grant Carlin | 269 | 1.4 | +1.4 | |
Democratic Labor | Elizabeth Pistor | 151 | 0.8 | +0.8 | |
| Total formal votes | 19,410 | 92.8 | –3.8 | ||
| Informal votes | 1,505 | 7.2 | +3.8 | ||
Turnout | 20,915 | 82.8 | –10.4 | ||
Two-candidate-preferred result | |||||
Labor | Susan Close | 10,277 | 52.9 | –9.8 | |
Independent | Gary Johanson | 9,133 | 47.1 | +47.1 | |
Labor hold | Swing | N/A | |||
At the 2012 Port Adelaide state by-election, only a TCP could be produced, as the Liberal Party of Australia (and Family First Party and independent candidate Max James), who contested the previous election and gained a primary vote of 26.8 percent (and 5.9 percent, and 11.0 percent respectively), did not contest the by-election. On a TPP margin of 12.8 points from the 2010 election, considered a safe margin on the current pendulum, Labor would probably have retained their TPP margin based on unchanged statewide Newspoll since the previous election. Labor retained the seat on a 52.9 percent TCP against Johanson after the distribution of preferences.[21][22][23]
Unlike previous examples, neither a TPP or TCP swing can be produced, as the 2010 result was between Labor and Liberal rather than Labor and independent with no Liberal candidate. An increase or decrease in margins in these situations cannot be meaningfully interpreted as swings. As explained by the ABC's Antony Green, when a major party does not contest a by-election, preferences from independents or minor parties that would normally flow to both major parties does not take place, causing asymmetric preference flows. Examples of this are the 2008 Mayo and 2002 Cunningham federal by-elections, with seats returning to TPP form at the next election.[24] This contradicts News Ltd claims of large swings and a potential Liberal Party win in Port Adelaide at the next election.[25][26]
House of Representatives primary, two-party and seat results
A two-party system has existed in the Australian House of Representatives since the two non-Labor parties merged in 1909. The 1910 election was the first to elect a majority government, with the Australian Labor Party concurrently winning the first Senate majority. Prior to 1909 a three-party system existed in the chamber. A two-party-preferred vote (2PP) has been calculated since the 1919 change from first-past-the-post to preferential voting and subsequent introduction of the Coalition. ALP = Australian Labor Party, L+NP = grouping of Liberal/National/LNP/CLP Coalition parties (and predecessors), Oth = other parties and independents.
| Election Year | Labour | Free Trade | Protectionist | Independent | Other parties | Total seats | ||||
|---|---|---|---|---|---|---|---|---|---|---|
1st | 1901 | 14 | 28 | 31 | 2 | | 75 | |||
| Election Year | Labour | Free Trade | Protectionist | Independent | Other parties | Total seats | ||||
2nd | 1903 | 23 | 25 | 26 | | 1 | Revenue Tariff | 75 | ||
| Election Year | Labour | Anti-Socialist | Protectionist | Independent | Other parties | Total seats | ||||
3rd | 1906 | 26 | 26 | 21 | 1 | 1 | Western Australian | 75 | ||
| Primary vote | 2PP vote | Seats | |||||||
|---|---|---|---|---|---|---|---|---|---|
| ALP | L+NP | Oth. | ALP | L+NP | ALP | L+NP | Oth. | Total | |
13 April 1910 election | 50.0% | 45.1% | 4.9% | – | – | 42 | 31 | 2 | 75 |
31 May 1913 election | 48.5% | 48.9% | 2.6% | – | – | 37 | 38 | 0 | 75 |
5 September 1914 election | 50.9% | 47.2% | 1.9% | – | – | 42 | 32 | 1 | 75 |
5 May 1917 election | 43.9% | 54.2% | 1.9% | – | – | 22 | 53 | 0 | 75 |
13 December 1919 election | 42.5% | 54.3% | 3.2% | 45.9% | 54.1% | 25 | 38 | 2 | 75 |
16 December 1922 election | 42.3% | 47.8% | 9.9% | 48.8% | 51.2% | 29 | 40 | 6 | 75 |
14 November 1925 election | 45.0% | 53.2% | 1.8% | 46.2% | 53.8% | 23 | 50 | 2 | 75 |
17 November 1928 election | 44.6% | 49.6% | 5.8% | 48.4% | 51.6% | 31 | 42 | 2 | 75 |
12 October 1929 election | 48.8% | 44.2% | 7.0% | 56.7% | 43.3% | 46 | 24 | 5 | 75 |
19 December 1931 election | 27.1% | 48.4% | 24.5% | 41.5% | 58.5% | 14 | 50 | 11 | 75 |
15 September 1934 election | 26.8% | 45.6% | 27.6% | 46.5% | 53.5% | 18 | 42 | 14 | 74 |
23 October 1937 election | 43.2% | 49.3% | 7.5% | 49.4% | 50.6% | 29 | 43 | 2 | 74 |
21 September 1940 election | 40.2% | 43.9% | 15.9% | 50.3% | 49.7% | 32 | 36 | 6 | 74 |
21 August 1943 election | 49.9% | 23.0% | 27.1% | 58.2% | 41.8% | 49 | 19 | 6 | 74 |
28 September 1946 election | 49.7% | 39.3% | 11.0% | 54.1% | 45.9% | 43 | 26 | 5 | 74 |
10 December 1949 election | 46.0% | 50.3% | 3.7% | 49.0% | 51.0% | 47 | 74 | 0 | 121 |
28 April 1951 election | 47.6% | 50.3% | 2.1% | 49.3% | 50.7% | 52 | 69 | 0 | 121 |
29 May 1954 election | 50.0% | 46.8% | 3.2% | 50.7% | 49.3% | 57 | 64 | 0 | 121 |
10 December 1955 election | 44.6% | 47.6% | 7.8% | 45.8% | 54.2% | 47 | 75 | 0 | 122 |
22 November 1958 election | 42.8% | 46.6% | 10.6% | 45.9% | 54.1% | 45 | 77 | 0 | 122 |
9 December 1961 election | 47.9% | 42.1% | 10.0% | 50.5% | 49.5% | 60 | 62 | 0 | 122 |
30 November 1963 election | 45.5% | 46.0% | 8.5% | 47.4% | 52.6% | 50 | 72 | 0 | 122 |
26 November 1966 election | 40.0% | 50.0% | 10.0% | 43.1% | 56.9% | 41 | 82 | 1 | 124 |
25 October 1969 election | 47.0% | 43.3% | 9.7% | 50.2% | 49.8% | 59 | 66 | 0 | 125 |
2 December 1972 election | 49.6% | 41.5% | 8.9% | 52.7% | 47.3% | 67 | 58 | 0 | 125 |
18 May 1974 election | 49.3% | 44.9% | 5.8% | 51.7% | 48.3% | 66 | 61 | 0 | 127 |
13 December 1975 election | 42.8% | 53.1% | 4.1% | 44.3% | 55.7% | 36 | 91 | 0 | 127 |
10 December 1977 election | 39.7% | 48.1% | 12.2% | 45.4% | 54.6% | 38 | 86 | 0 | 124 |
18 October 1980 election | 45.2% | 46.3% | 8.5% | 49.6% | 50.4% | 51 | 74 | 0 | 125 |
5 March 1983 election | 49.5% | 43.6% | 6.9% | 53.2% | 46.8% | 75 | 50 | 0 | 125 |
1 December 1984 election | 47.6% | 45.0% | 7.4% | 51.8% | 48.2% | 82 | 66 | 0 | 148 |
11 July 1987 election | 45.8% | 46.1% | 8.1% | 50.8% | 49.2% | 86 | 62 | 0 | 148 |
24 March 1990 election | 39.4% | 43.5% | 17.1% | 49.9% | 50.1% | 78 | 69 | 1 | 148 |
11 Mar 1993 Newspoll | 44% | 45% | 11% | 49.5% | 50.5% | ||||
13 March 1993 election | 44.9% | 44.3% | 10.7% | 51.4% | 48.6% | 80 | 65 | 2 | 147 |
28–29 Feb 1996 Newspoll | 40.5% | 48% | 11.5% | 46.5% | 53.5% | ||||
2 March 1996 election | 38.7% | 47.3% | 14.0% | 46.4% | 53.6% | 49 | 94 | 5 | 148 |
30 Sep – 1 Oct 1998 Newspoll | 44% | 40% | 16% | 53% | 47% | ||||
3 October 1998 election | 40.1% | 39.5% | 20.4% | 51.0% | 49.0% | 67 | 80 | 1 | 148 |
7–8 Nov 2001 Newspoll | 38.5% | 46% | 15.5% | 47% | 53% | ||||
10 November 2001 election | 37.8% | 43.0% | 19.2% | 49.0% | 51.0% | 65 | 82 | 3 | 150 |
6–7 Oct 2004 Newspoll | 39% | 45% | 16% | 50% | 50% | ||||
9 October 2004 election | 37.6% | 46.7% | 15.7% | 47.3% | 52.7% | 60 | 87 | 3 | 150 |
20–22 Nov 2007 Newspoll | 44% | 43% | 13% | 52% | 48% | ||||
24 November 2007 election | 43.4% | 42.1% | 14.5% | 52.7% | 47.3% | 83 | 65 | 2 | 150 |
17–19 Aug 2010 Newspoll | 36.2% | 43.4% | 20.4% | 50.2% | 49.8% | ||||
21 August 2010 election | 38.0% | 43.3% | 18.7% | 50.1% | 49.9% | 72 | 72 | 6 | 150 |
3–5 Sep 2013 Newspoll | 33% | 46% | 21% | 46% | 54% | ||||
7 September 2013 election | 33.4% | 45.6% | 21.0% | 46.5% | 53.5% | 55 | 90 | 5 | 150 |
28 Jun – 1 Jul 2016 Newspoll | 35% | 42% | 23% | 49.5% | 50.5% | ||||
2 July 2016 election | 34.7% | 42.0% | 23.3% | 49.6% | 50.4% | 69 | 76 | 5 | 150 |
| Polling conducted by Newspoll and published in The Australian. Three percent margin of error. | |||||||||
See also
- Swing (Australian politics)
- Mackerras Pendulum
External links
National and state-by-state TPP results since 1949 – Australian Electoral Commission
National TPP results since 1937 – Malcolm Mackerras
References
^ "How the House of Representatives votes are counted". Australian Electoral Commission. Retrieved 11 March 2012..mw-parser-output cite.citation{font-style:inherit}.mw-parser-output q{quotes:"""""""'""'"}.mw-parser-output code.cs1-code{color:inherit;background:inherit;border:inherit;padding:inherit}.mw-parser-output .cs1-lock-free a{background:url("//upload.wikimedia.org/wikipedia/commons/thumb/6/65/Lock-green.svg/9px-Lock-green.svg.png")no-repeat;background-position:right .1em center}.mw-parser-output .cs1-lock-limited a,.mw-parser-output .cs1-lock-registration a{background:url("//upload.wikimedia.org/wikipedia/commons/thumb/d/d6/Lock-gray-alt-2.svg/9px-Lock-gray-alt-2.svg.png")no-repeat;background-position:right .1em center}.mw-parser-output .cs1-lock-subscription a{background:url("//upload.wikimedia.org/wikipedia/commons/thumb/a/aa/Lock-red-alt-2.svg/9px-Lock-red-alt-2.svg.png")no-repeat;background-position:right .1em center}.mw-parser-output .cs1-subscription,.mw-parser-output .cs1-registration{color:#555}.mw-parser-output .cs1-subscription span,.mw-parser-output .cs1-registration span{border-bottom:1px dotted;cursor:help}.mw-parser-output .cs1-hidden-error{display:none;font-size:100%}.mw-parser-output .cs1-visible-error{font-size:100%}.mw-parser-output .cs1-subscription,.mw-parser-output .cs1-registration,.mw-parser-output .cs1-format{font-size:95%}.mw-parser-output .cs1-kern-left,.mw-parser-output .cs1-kern-wl-left{padding-left:0.2em}.mw-parser-output .cs1-kern-right,.mw-parser-output .cs1-kern-wl-right{padding-right:0.2em}
^ "Historical national and state-by-state two-party preferred results". Australian Electoral Commission. 2016-02-17. Retrieved 2016-08-01.
^ Malcolm Mackerras. "The Results and the Pendulum". Australian National University. Retrieved 2016-08-01.
^ "Non-classic divisions, 2010 federal election". Australian Electoral Commission. 2013-11-04. Retrieved 2016-08-01.
^ Antony Green (2012-02-10). "How Should Reachtel's Ashgrove Polls be Interpreted". Blogs.abc.net.au. Retrieved 2016-08-01.
^ Green, Anthony (15 January 2018). "2017 Bennelong by-election: Commentary". abc.net.au. ABC News.
^ "2009 Frome by-election results: State Electoral Office". Seo.sa.gov.au. Archived from the original on 20 January 2009. Retrieved 28 July 2010.
^ "2009 Frome By-election: ABC Elections". Abc.net.au. 2 February 2009. Retrieved 28 July 2010.
^ "Frome by-election goes down to the wire". ABC Online. 18 January 2009. Retrieved 25 January 2009.
^ Green, Antony. "Frome By-election Results". ABC Online. Retrieved 25 January 2009.
^ Emmerson, Russell; Pepper, Chris (18 January 2009). "Liberals confident they'll hold Outback seat of Frome". The Advertiser. Archived from the original on 20 January 2009. Retrieved 25 January 2009.
^ "Liberals claim victory in Frome". Poll Bludger (Crikey). 21 January 2009. Archived from the original on 31 January 2009. Retrieved 25 January 2009. This article reproduces the original Liberal press release, no longer available on the SA Liberal site.
^ Hendrik Gout (30 January 2009). "Frome one loss to another: Independent Weekly 30/1/2009". Independentweekly.com.au. Retrieved 28 July 2010.
^ Richardson, Tom (30 January 2009). "Frome, a lost moment for the Libs: Independent Weekly 30/1/2009". Independentweekly.com.au. Retrieved 28 July 2010.
^ "District of Frome" (PDF). Retrieved 28 July 2010.
[permanent dead link]
^ Pepper, Chris (25 January 2009). "Shock Frome loss rocks SA Liberals". The Advertiser. Retrieved 25 January 2009.
^ Jamie Walker (31 January 2009). "Peace plea as Nationals take revenge on Liberals at polling booth: The Australian 31/1/2009". Theaustralian.news.com.au. Retrieved 28 July 2010.
^ David Nason, New York correspondent (26 January 2009). "Leader left with pumpkin: The Australian 26/1/2009". Theaustralian.news.com.au. Retrieved 28 July 2010.
^ Gavin Lower and David Nason (26 January 2009). "Libs demand recount after shock poll loss: The Australian 26/1/2009". Theaustralian.news.com.au. Retrieved 28 July 2010.
^ "Melbourne 2010 election result". Australian Electoral Commission. 2010-09-29. Retrieved 2016-08-01.
^ 2012 Port Adelaide by-election results: ECSA Archived 28 July 2012 at Archive.is
^ Port Adelaide by-election preference distribution: ECSA Archived 9 April 2013 at the Wayback Machine.
^ Antony Green (2012-02-20). "2012 Port Adelaide by-election results". Abc.net.au. Retrieved 2016-08-01.
^ Antony Green (2012-02-13). "A Comment on the Size of the Port Adelaide Swing". Blogs.abc.net.au. Retrieved 2016-08-01.
^ "Port now a poll target for Liberals". The Advertiser. 2012-03-02. Retrieved 2016-08-01.
^ Susan Close wins Port Adelaide for Labor but seat now marginal: The Australian 11 February 2012
Labor Keeps Port Adelaide, Ramsay in South Australian by-elections: The Australian 12 February 2012
By-election swings carry 'message for Labor': The Australian 13 February 2012
Parliament of Australia | |||||
|---|---|---|---|---|---|
| Components |
|  | |||
| Parliamentary officers |
| ||||
| Members |
| ||||
| Parliaments |
| ||||
| Procedure |
| ||||
| Elections |
| ||||
| Locations |
| ||||


